Chapter 9: Graphs
9.1 Indicating position
In Chapter 8 you represented algebraic inequalities on a number line. A number line can also be used to give you the position of a number. The number line below shows that the number is three units to the right of zero and the number is five units to the left of zero.

Last year you learnt that we can also show numbers on a vertical number line. A thermometer is an example of an instrument that uses a vertical number line. On the number line below, the number is seven units above zero and the number is 4 units below zero.

A line has only length. It does not have breadth or width. We say a line has only one dimension. When we describe position along a straight line, we use only one dimension.
line A line is a continuous path with length but no breadth. A line is one-dimensional.
Look at the grid below.
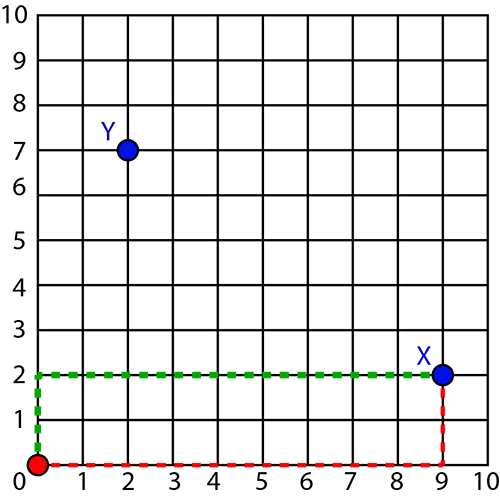
We can describe the position of point X as nine units to the right and two units upwards from zero. This relationship is shown by the red dashed lines. The green dashed lines show the same relationship. From zero, point X is two units upwards and nine units to the right. Similarly, the position of point Y is seven units upwards and two units to the right of zero. We can also say it is two units to the right and seven units upwards from zero.
The grid represents a plane. A plane is a flat surface that has length and breadth. We say a plane has two dimensions. When we describe position on a plane, we use two dimensions.
We can use the length and breadth of a plane to determine its area.
plane A plane is a flat surface that has length and breadth. A plane is two-dimensional.
In later grades you will learn how to describe position in a three-dimensional space, which has length and breadth and height.
9.2 The Cartesian plane
The Cartesian plane is a plane used to show the position of any point relative to a horizontal number line and a vertical number line. The horizontal number line is called the -axis and the vertical number line is called the -axis. The two axes intersect at zero on both number lines. This point of intersection is called the origin.
The Cartesian plane is named after a French mathematician, René Descartes, who introduced the system.
The position of any point on the Cartesian plane is given as two coordinates, an -coordinate and a -coordinate. The -coordinate gives the horizontal relationship between the point and the origin. The -coordinate gives the vertical relationship between the point and the origin. The coordinates are written in the form . When we work on the Cartesian plane, the -coordinate is always placed first. The coordinates of the origin are .
Cartesian plane The Cartesian plane is a plane used to show the position of any point relative to the intersection of a horizontal number line and a vertical number line.
origin The origin on the Cartesian plane is the point of intersection of the -axis and the -axis. Its coordinates are .
coordinates The coordinates of a point on the Cartesian plane give the position of the point relative to the origin of a horizontal number line and a vertical number line. Coordinates are written in the form .
Worked example 9.1: Determining the coordinates of a point on the Cartesian plane
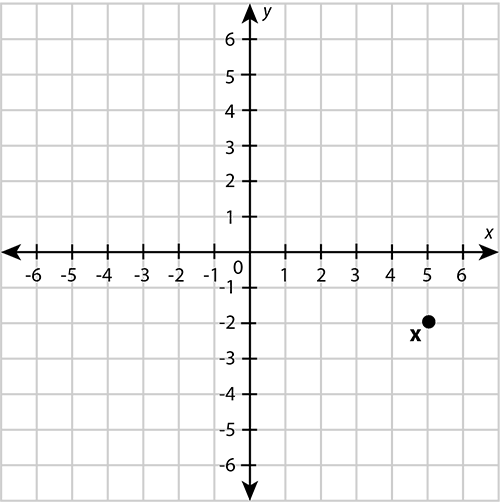
Determine the coordinates of point on the Cartesian plane below.
-
Step 1: Write down the label of the point using the general format for coordinates.
-
Step 2: Determine the horizontal displacement of the point from the origin. This is the -coordinate.
"Displacement" means how much something has moved.
Along the horizontal axis, you must move from the origin to the right until you get to the number .
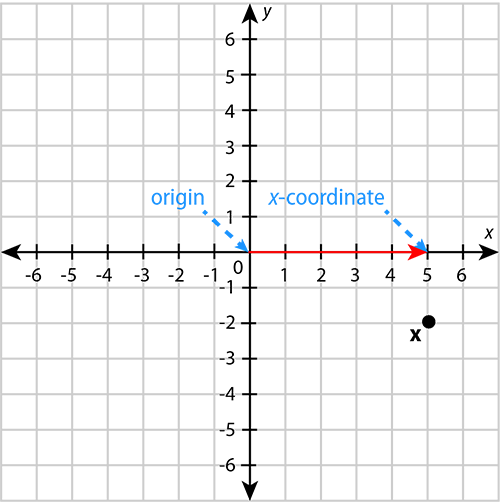
The -coordinate is .
-
Step 3: Determine the vertical displacement of the point from the origin. This is the -coordinate.
To get from the number on the horizontal axis to point , you must move two units downwards. This is the same as moving from the origin downwards to the number .
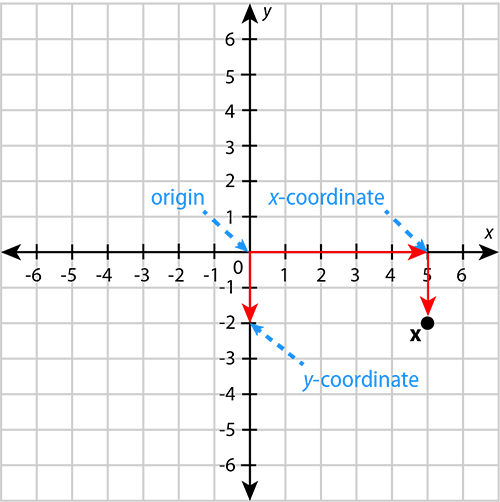
The -coordinate is .
-
Step 4: Write down the answer in the correct format.
Remember that the -coordinate must always be written down first, in other words, on the left.
When we want to show the position of a point on the Cartesian plane, we plot the point as described in the worked example that follows.
plot We plot a point on the Cartesian plane by marking it according to its coordinates.
Worked example 9.2: Plotting a point on the Cartesian plane
Plot the point on the Cartesian plane.
-
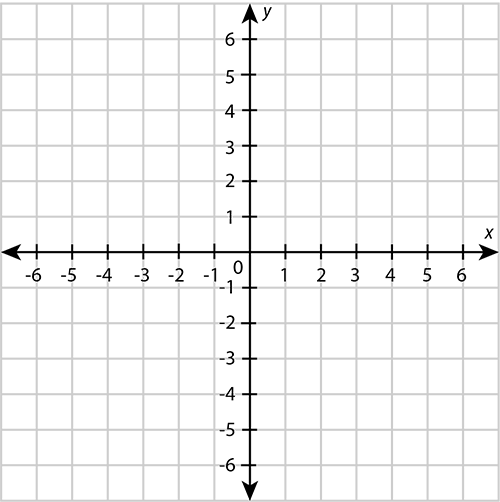
Step 1: Draw the axes of the Cartesian plane correctly.
- The axes must be perpendicular to each other.
- There must be an arrowhead at both ends of each axis.
- Label the horizontal axis and the vertical axis .
- Label the origin with the number 0.
- Insert equal divisions on each axis. Label them with whole numbers, as you would do for a number line.
-
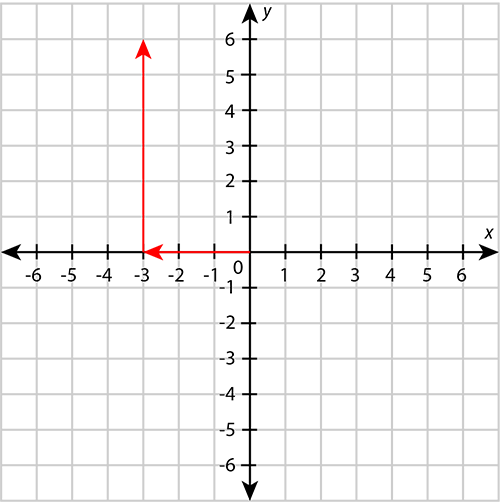
Step 2: From the origin, move along the horizontal axis until you reach the -coordinate.
The -coordinate is .

-
Step 3: From the -coordinate, move parallel to the vertical axis towards the -coordinate. Stop when you are across from the -coordinate.
The -coordinate is .
-
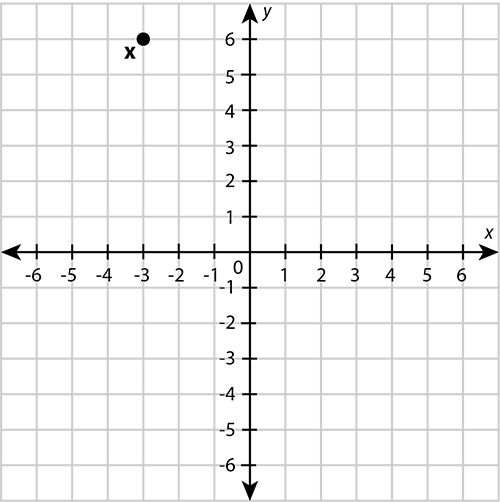
Step 4: Draw a dot to show the position of the point. Add the label of the point.
Exercise 9.1: Determine the coordinates and plot points on the Cartesian plane
-
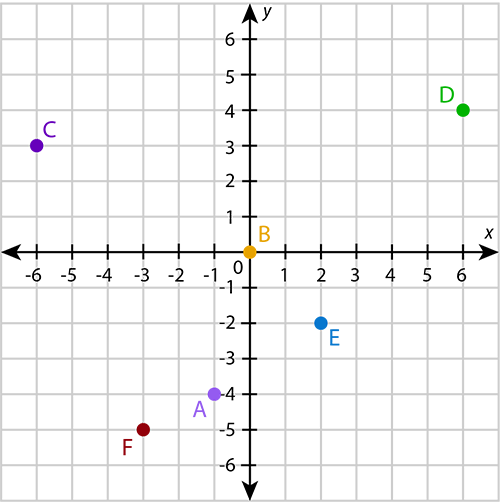
Write down the coordinates for each of the points A to F.
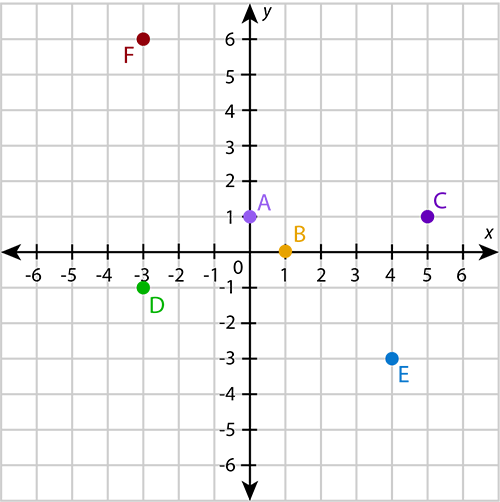
If the -coordinate of a point is 0, it means the point is not displaced from the origin in a horizontal direction. The point lies on the -axis. Similarly, if the -coordinate of a point is 0, it means the point is not displaced from the origin in a vertical direction. The point lies on the -axis.
-
Plot the following points on the Cartesian plane: , , , , ,
9.3 Plotting graphs
Compiling a table of values
An algebraic equation can be used to pair up -coordinates and -coordinates on the Cartesian plane.
Take the -coordinate as an example. If we put the number in the place of in the equation , then . This means the equation pairs the -coordinate with the -coordinate . This gives us a point in the Cartesian plane: .
Another equation will pair up the -coordinate with another -coordinate. For the equation , the -coordinate that corresponds to the -coordinate is . This gives us the point on the Cartesian plane.
We can use this method to compile a table of coordinate pairs for a specific equation. Such a table is known as a table of values.
table of values A table of values shows the pairs of coordinates for a given algebraic equation, and can be used for plotting the points.
Worked example 9.3: Compiling a table of values
Compile a table of values for the equation .
-
Step 1: Choose at least five -coordinates to pair up. The whole numbers usually work well.
\begin{array}{|c|c|c|c|c|c|} \hline x & -2 & -1 & \;0\; & \;1\; & \;2\; \\ \hline y & & & & & \\ \hline \end{array} -
Step 2: Replace the in the given equation with each of the values you chose in Step 1. Calculate the corresponding -coordinates.
\begin{align} y&=3x-1 \\ &=3(-2)-1 \\ &=-6-1 \\ &=-7 \end{align} \begin{align} y&=3x-1 \\ &=3(-1)-1 \\ &=-3-1 \\ &=-4 \end{align} \begin{align} y&=3x-1 \\ &=3(0)-1 \\ &=0-1 \\ &=-1 \end{align} \begin{align} y&=3x-1 \\ &=3(1)-1 \\ &=3-1 \\ &=2 \end{align} \begin{align} y&=3x-1 \\ &=3(2)-1 \\ &=6-1 \\ &=5 \end{align} -
Step 3: Enter the values you calculated in Step 2 in your table.
\begin{array}{|c|c|c|c|c|c|} \hline x & -2 & -1 & \;0\; & \;1\; & \;2\; \\ \hline y & -7 & -4 & -1 & 2 & 5 \\ \hline \end{array}
Exercise 9.2: Compile a table of values
Compile a table of values for each of the following equations.
-
\begin{array}{|c|c|c|c|c|c|} \hline x & -2 & -1 & \;0\; & \;1\; & \;2\; \\ \hline y & 2 & 3 & 4 & 5 & 6 \\ \hline \end{array}
-
\begin{array}{|c|c|c|c|c|c|} \hline x & -2 & -1 & \;0\; & \;1\; & \;2\; \\ \hline y & -4 & -1 & 2 & 5 & 8 \\ \hline \end{array}
-
\begin{array}{|c|c|c|c|c|c|} \hline x & -2 & -1 & \;0\; & \;1\; & \;2\; \\ \hline y & 10 & 5 & 0 & -5 & -10 \\ \hline \end{array}
-
\begin{array}{|c|c|c|c|c|c|} \hline x & -2 & -1 & \;0\; & \;1\; & \;2\; \\ \hline y & 6 & 4 & 2 & 0 & -2 \\ \hline \end{array}
-
\begin{array}{|c|c|c|c|c|c|} \hline x & -2 & -1 & \;0\; & \;1\; & \;2\; \\ \hline y & 2\frac{1}{2} & 1\frac{1}{2} & \frac{1}{2} & -\frac{1}{2} & -1\frac{1}{2} \\ \hline \end{array}
Plotting points from a table of values
Each pair in a table of values represents the coordinates of a point on the Cartesian plane. An algebraic equation therefore gives the relationship between the -coordinates and the -coordinates of a collection of points. We can plot these points to see whether they form a pattern. This pattern or shape is called a graph.
graph A graph is a pattern on a Cartesian plane formed by points whose coordinates are obtained from a given equation.
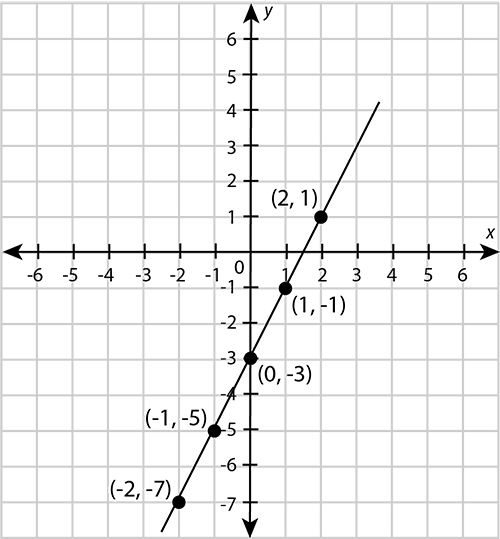
Worked example 9.4: Plotting a graph
Plot a graph for the equation .
-
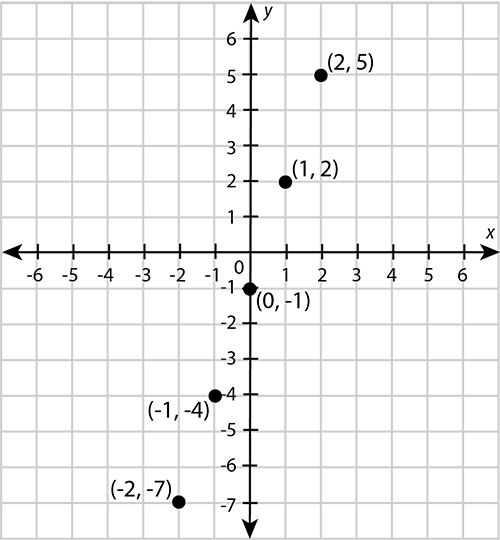
Step 1: Compile a table of values.
We compiled a table of values for this equation in the previous worked example:
\begin{array}{|c|c|c|c|c|c|} \hline x & -2 & -1 & \;0\; & \;1\; & \;2\; \\ \hline y & -7 & -4 & -1 & 2 & 5 \\ \hline \end{array} -
Step 2: Write down the coordinates of the points represented in the table of values in the correct format.
-
Step 3: Draw the axes of the Cartesian plane correctly.
- The axes must be perpendicular to each other.
- There must be an arrowhead at both ends of each axis.
- Label the horizontal axis and the vertical axis .
- Label the origin with the number 0.
- Insert equal divisions on each axis. Label them with whole numbers, as you would do for a number line.
-
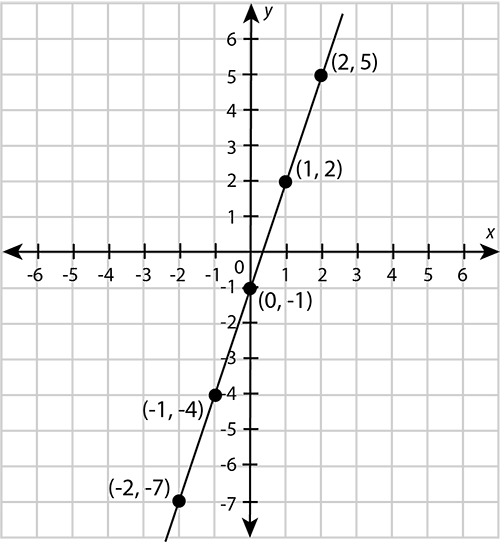
Step 4: Plot each of the points in Step 2 as described in Worked example 9.2.
-
Step 5: Draw a line through the points to get the graph.
These points from a straight line, so you must use a ruler to draw the line.
Exercise 9.3: Plot graphs
Plot a graph for each of the following equations.
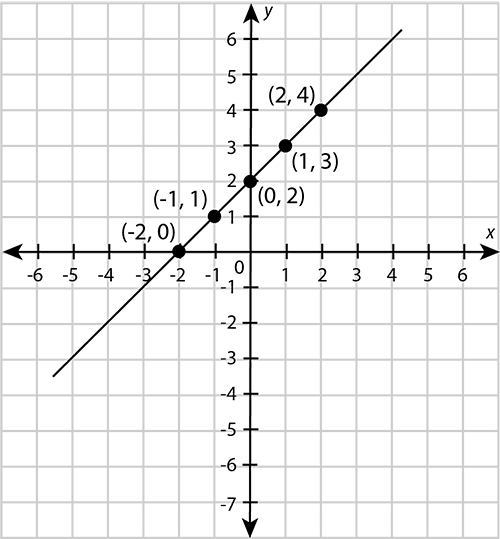
-
\begin{array}{|c|c|c|c|c|c|} \hline x & -2 & -1 & \;0\; & \;1\; & \;2\; \\ \hline y & 0 & 1 & 2 & 3 & 4 \\ \hline \end{array}
-
\begin{array}{|c|c|c|c|c|c|} \hline x & -2 & -1 & \;0\; & \;1\; & \;2\; \\ \hline y & -7 & -5 & -3 & -1 & 1 \\ \hline \end{array}
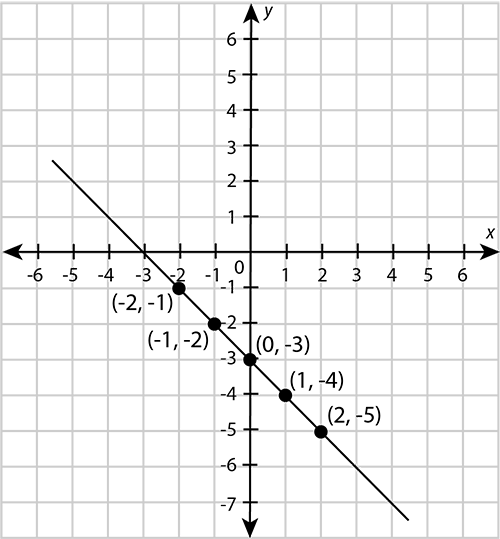
-
\begin{array}{|c|c|c|c|c|c|} \hline x & -2 & -1 & \;0\; & \;1\; & \;2\; \\ \hline y & -1 & -2 & -3 & -4 & -5 \\ \hline \end{array}
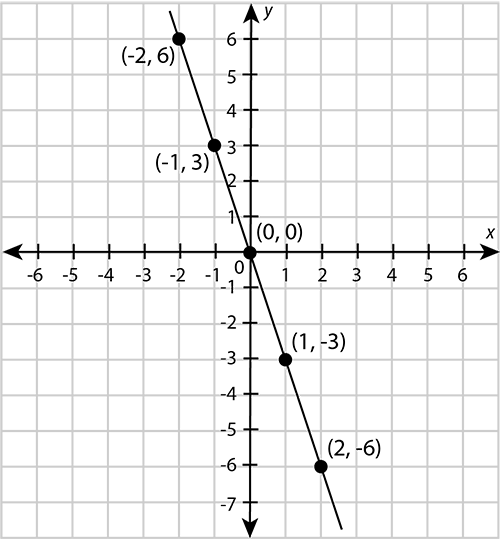
-
\begin{array}{|c|c|c|c|c|c|} \hline x & -2 & -1 & \;0\; & \;1\; & \;2\; \\ \hline y & 6 & 3 & 0 & -3 & -6 \\ \hline \end{array}
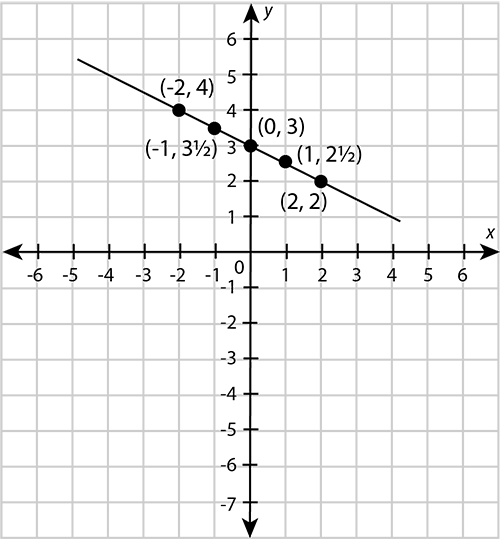
-
\begin{array}{|c|c|c|c|c|c|} \hline x & -2 & -1 & \;0\; & \;1\; & \;2\; \\ \hline y & 4 & 3\frac{1}{2} & 3 & 2\frac{1}{2} & 2 \\ \hline \end{array}
9.4 Practical applications
Graphs can be very useful in everyday situations. Here are some examples:
- A distance-time graph shows us the relationship between the distance covered and time elapsed for any given journey. Note that .
- A velocity-time graph shows us the relationship between the displacement of an object as time goes by for any given journey. The displacement of an object is the distance it covered in a certain direction in a straight line. Note that .
- A wage-hours graph shows the relationship between the number of hours worked and the total wages earned.
- A cost-items graph shows the relationship between the number of items bought and the total cost.
Worked example 9.5: Plotting and interpreting a wages-time graph
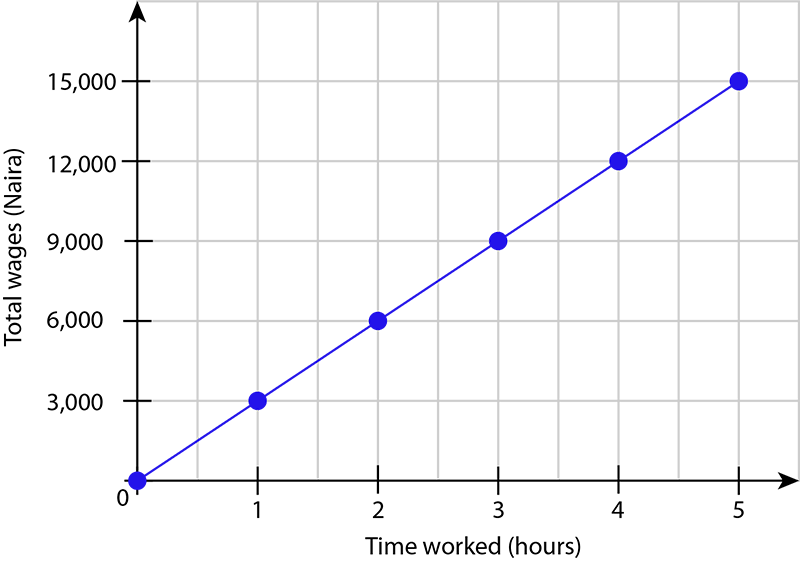
Ruqayyah earns ₦3,000 per hour. Plot a graph to show her total wages for up to five hours of work. Use the graph to answer the following questions:
- Determine Ruqayyah's wages for three hours of work.
- Determine how long Ruqayyah must work to earn wages of ₦12,000.
-
Step 1: Compile a table of values. Start at zero.
Ruqayyah earns ₦3,000 per hour. Therefore:
\begin{array}{|l|r|r|r|r|r|r|} \hline \text{Time worked} & \;\;\;0 & 1 & 2 & 3 & 4 & 5 \\ \hline \text{Total wages} & 0 & 3,000 & 6,000 & 9,000 & 12,000 & 15,000 \\ \hline \end{array} -
Step 2: Draw a horizontal axis and vertical axis.
- Only draw the negative parts of the axes if they are needed. There is no such thing as negative time or negative wages, so in this example we only draw the positive parts of the axes.
- Insert an arrowhead at the end of each axis.
- Label each axis with a description of what the axis represents, as well as a unit of measurement.
- Label the origin with the number 0.
- Insert equal divisions on each axis. Label them with appropriate numbers.

-
Step 3: Plot the points represented in the table of values you compiled in Step 1. Draw a line through the points to get the graph.
-
Step 4: Use the graph to answer the questions.
To determine Ruqayyah's wages for three hours of work:
- Find 3 hours on the horizontal axis.
- Move from the value on the horizontal axis straight towards the graph.
- From the position on the graph, move straight towards the vertical axis.
- Write down the value from the vertical axis.
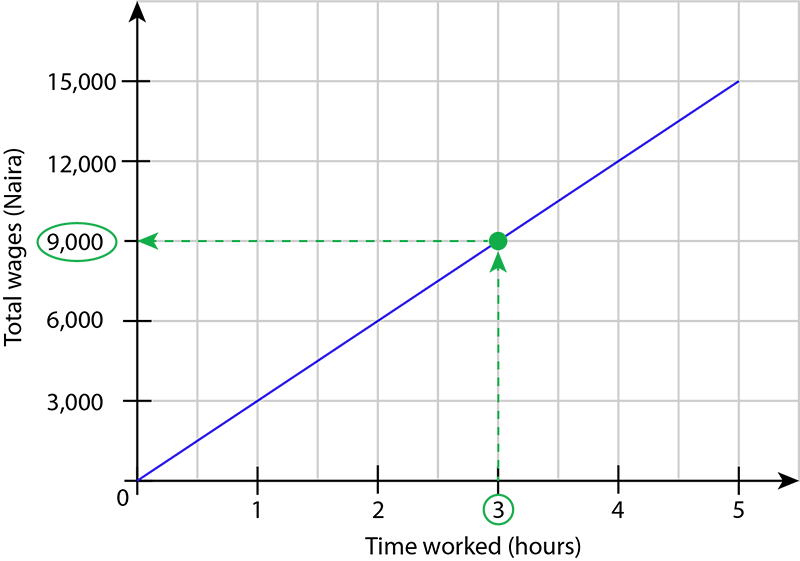
For three hours of work, Ruqayyah receives wages of ₦9,000.
To determine how long Ruqayyah must work to earn wages of ₦12,000:
- Find ₦12,000 on the vertical axis.
- Move from the value on the vertical axis straight towards the graph.
- From the position on the graph, move straight towards the horizontal axis.
- Write down the value from the horizontal axis.
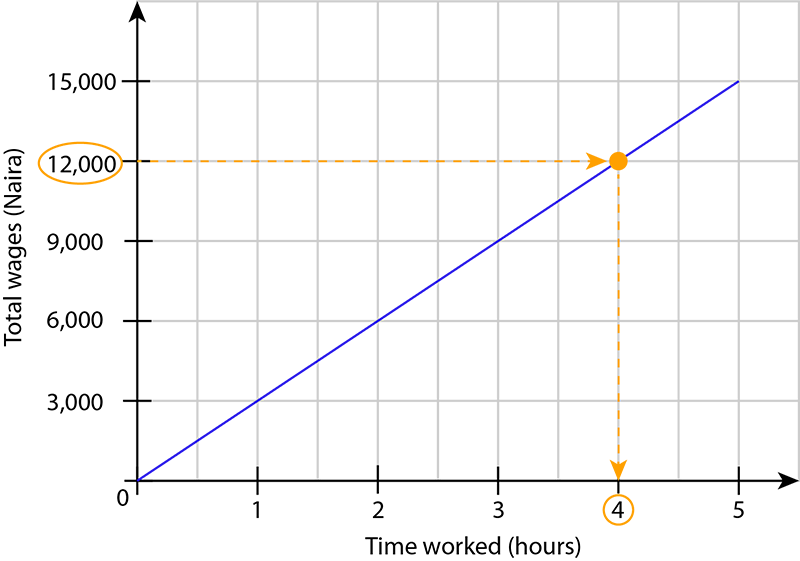
Ruqayyah must work 4 hours to earn wages of ₦12,000.
Worked example 9.6: Interpreting a distance-time graph
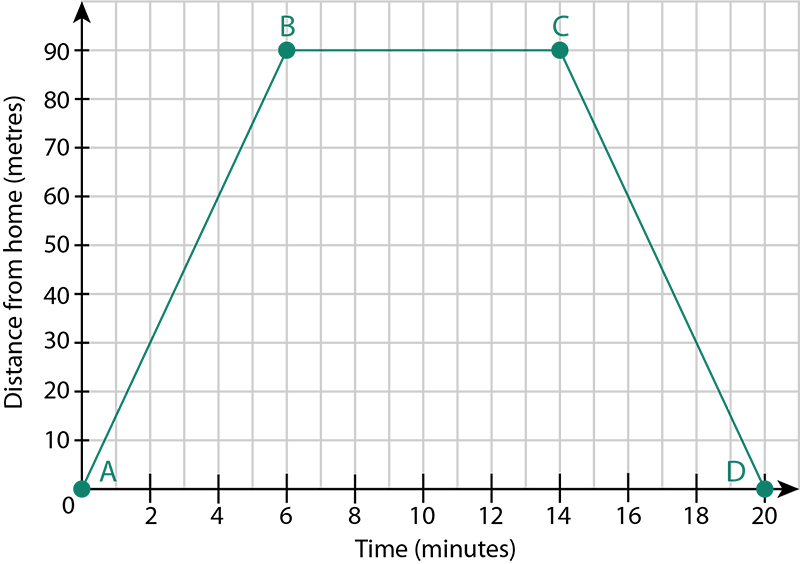
Chizoba lives 90 metres from a shop. The graph shows his journey to the shop, the time he spent at the shop, and his journey back home. Interpret each section of the graph.
-
Step 1: Look at the first section of the graph, AB.
- The graph shows that the distance from Chizoba's home increases as time goes by. This means he is moving towards the shop.
- Point B is across from the distance 90 metres on the vertical axis. This means Chizoba is at the shop.
- Point B is straight above from 6 minutes on the horizontal axis. This means it took Chizoba 6 minutes to reach the shop.
-
Step 2: Look at the second section of the graph, BC.
- The graph shows that the distance from Chizoba's home remains constant at 90 metres at time goes by. This means Chizoba did not move away from the shop.
- Point B is straight above 6 minutes on the horizontal axis. Point C is straight above 14 minutes on the horizontal axis. This means Chizoba spent minutes at the shop.
-
Step 3: Look at the third section of the graph, CD.
- The graph shows that the distance from Chizoba's home decreases as time goes by. This means he is moving away from the shop and towards his home.
- Point D is at zero on the vertical axis. This means Chizoba is back at his home.
- Point C is above 14 minutes on the horizontal axis. Point D is at 20 minutes on the horizontal axis. This means it took Chizoba minutes to move from the shop back to his home.
- Point D shows that the full journey took 20 minutes. We can confirm this by adding the time for each interval:
Exercise 9.4: Apply graphs to everyday situations
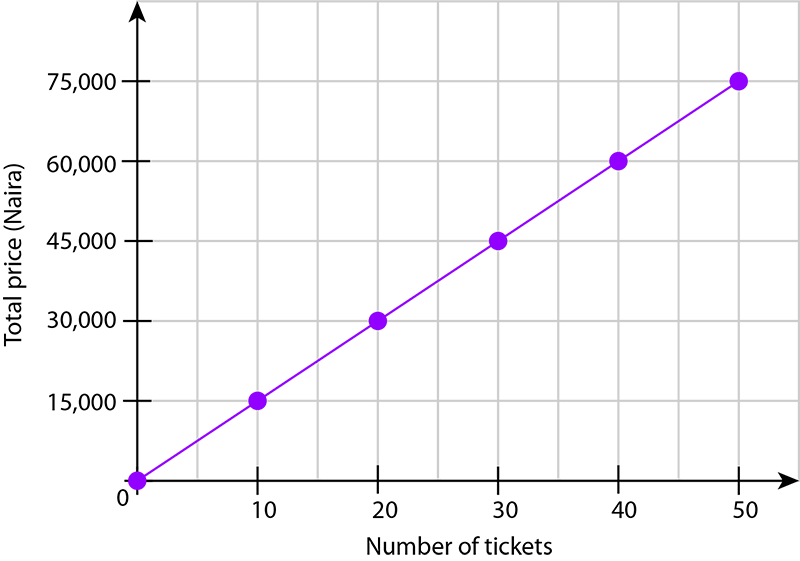
- The full price of one movie ticket for an adult is ₦1,500 at a certain cinema.
- Plot a graph to show the total price of 10, 20, 30, 40 and 50 of these movie tickets.
\begin{array}{|l|r|r|r|r|r|r|} \hline \text{Number of tickets} & \;\;\;0 & 10 & 20 & 30 & 40 &50 \\ \hline \text{Total price} & 0 & 15,000 & 30,000 & 45,000 & 60,000 & 75,000 \\ \hline \end{array}
- Use the graph to determine the total price of 35 of these movie tickets.
On the horizontal axis, 35 is halfway between 30 and 40.
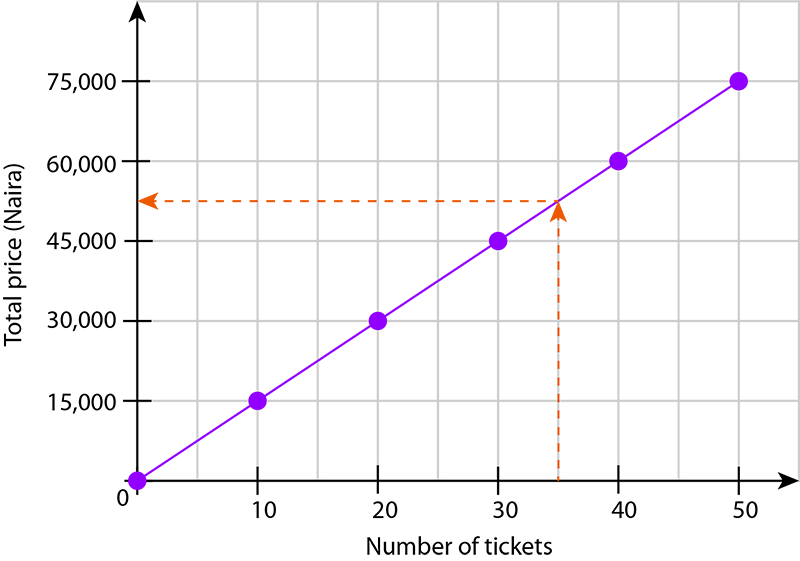
This gives the number halfway between ₦45,000 and ₦60,000 on the vertical axis: \(\dfrac{ ₦45,000 + ₦60,000}{2}= ₦52,500\)
The price for 35 tickets is ₦52,500.
- Use the graph to determine how many of these movie tickets you can buy for ₦37,500.
On the vertical axis, ₦37,500 is halfway between ₦30,000 and ₦45,000, because:
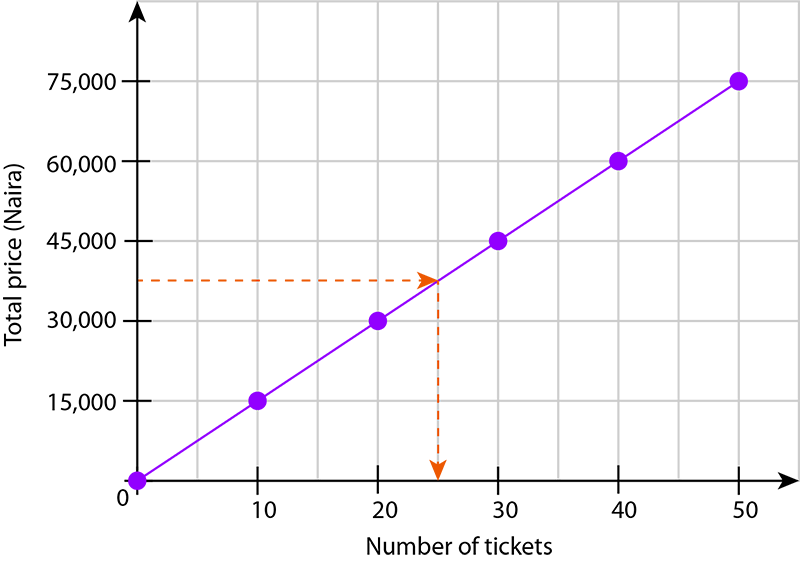
From the point on the graph for ₦37,500, straight down to the horizontal axis gives the number halfway between 20 and 30: .
You can buy 25 tickets for ₦37,500.
-
Adaeze lives 80 m from her friend. She walks to her friend's home and spends a few minutes there. Adaeze then walks back home. The graph shows her journey. Use the graph to answer the questions that follow.
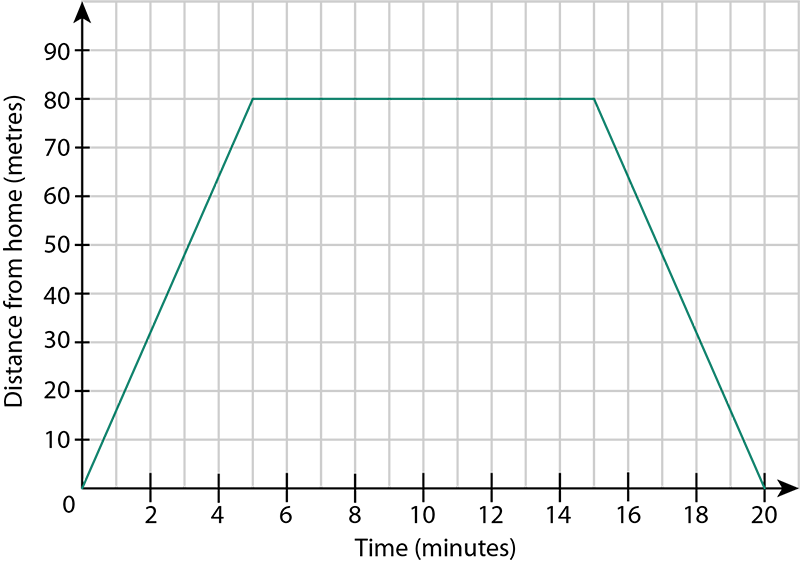
- How long did it take Adaeze to reach her friend's home?
Adaeze reached her friend's home when she was 80 metres from her own home.
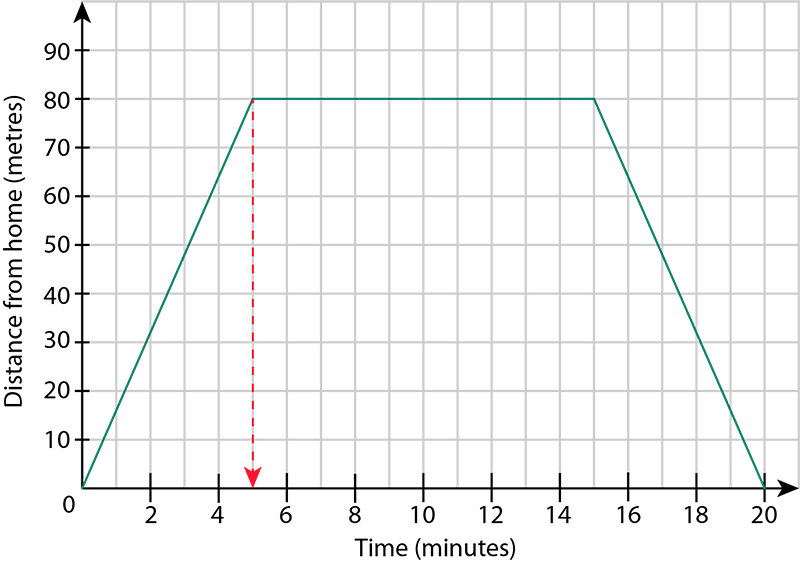
The corresponding time is 5 minutes, so it took 5 minutes for Adaeze to reach her friend's home.
- How much time did Adaeze spend at her friend's home?
Adaeze's distance from her home remained constant at 80 metres for 15 minutes 5 minutes = 10 minutes.
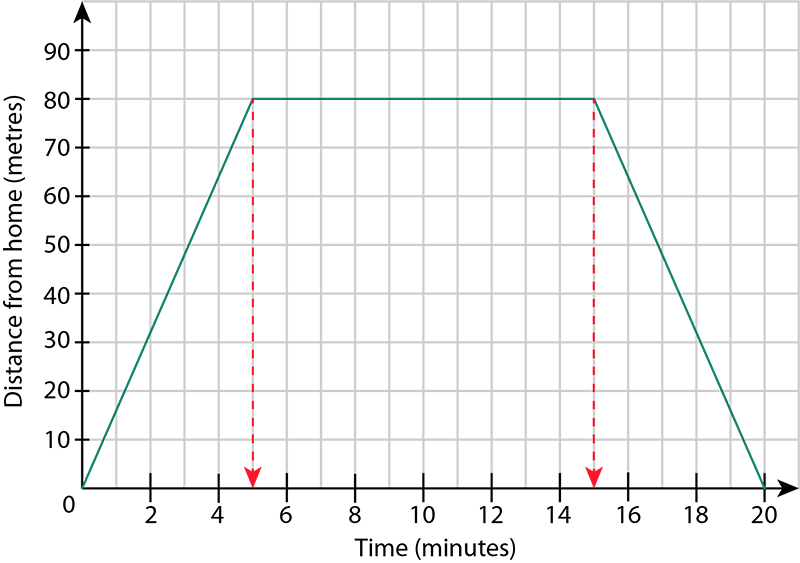
Adaeze spent 10 minutes at her friend's home.
- How long did it take Adaeze to walk back from her friend's home to her own home?
Adaeze's distance from her home decreased for 20 minutes 15 minutes = 5 minutes.
It took Adaeze 5 minutes to walk back to her own home.
-
The table shows the velocity of a car that is travelling in a straight line over a period of 90 seconds.
\begin{array}{|l|r|r|r|r|r|r|r|} \hline \text{Time (seconds)} & \;\;\;0 & 15 & 30 & 45 & 60 & 75 & 90\\ \hline \text{Velocity (m/s)} & 0 & 10 & 20 & 30 & 40 & 40 & 40 \\ \hline \end{array}- Plot a velocity-time graph for the car.
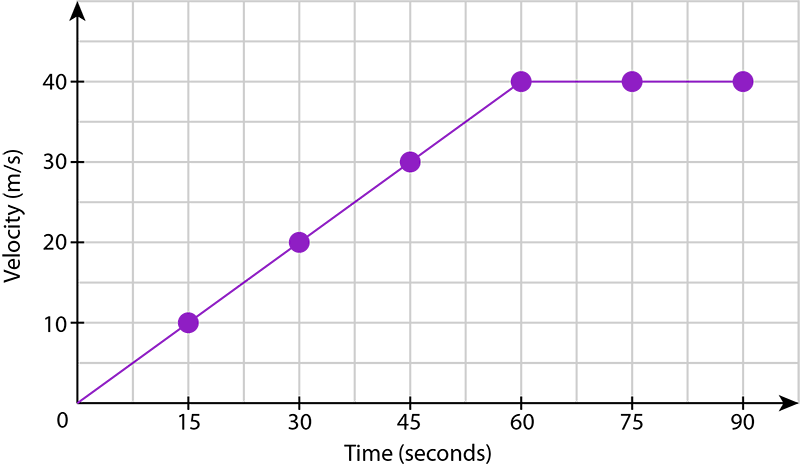
- Give the maximum velocity that the car reached.
The maximum value for velocity is 40 m/s.
- How long did it take the car to reach maximum velocity?
It took the car 60 seconds to reach a maximum velocity of 40 m/s.
- What happened from 60 seconds to 90 seconds?
The velocity of the car remained the same at 40 m/s.
- From 0 seconds to 60 seconds, the car accelerates from 0 m/s to 40 m/s. Determine the acceleration of the car.
\begin{align} \text{acceleration}&=\frac{\text{velocity}}{\text{time}} \\ &=\frac{40\text{ m/s}-0\text{ m/s}}{60\;\text s-0}\\ &=\frac{4}{6}\frac{\text m}{\text s}\times\frac{1}{\text s}\\ &=\frac{2}{3}\text{ m/s}^2 \end{align}
9.5 Summary
- A line is a continuous path with length but no breadth. A line is one-dimensional.
- A plane is a flat surface that has length and breadth. A plane is two-dimensional.
- The Cartesian plane is a plane used to show the position of any point relative to the intersection of a horizontal number line and a vertical number line.
- The origin on the Cartesian plane is the point of intersection of the -axis and the -axis. Its coordinates are .
- The coordinates of a point on the Cartesian plane give the position of the point relative to the origin of a horizontal number line and a vertical number line. Coordinates are written in the form .
- We plot a point on the Cartesian plane by marking it according to its coordinates.
- If the -coordinate of a point is 0, it means the point is not displaced from the origin in a horizontal direction. The point lies on the -axis. Similarly, if the -coordinate of a point is 0, it means the point is not displaced from the origin in a vertical direction. The point lies on the -axis.
- A table of values shows the pairs of coordinates for a given algebraic equation.
- A graph is a pattern formed on a Cartesian plane by points whose coordinates are obtained from a given equation.
- Graphs can be applied to everyday situations.