Chapter 17: Data collection and presentation
17.1 Collecting and organising data
You have learnt that statistics is useful as it allows us to interpret what has happened in the past, so that we can predict what is likely to happen in the future, and plan for it. A vital part of working with statistics is gathering the information, recording it, and then presenting it so that it can be understood easily and used by other people. This is called data handling.
data handling Data handling is gathering and recording information, and then presenting it in a way that can be understood easily and used by other people.
The data handling cycle
The process of data handling is summarised in the diagram below.
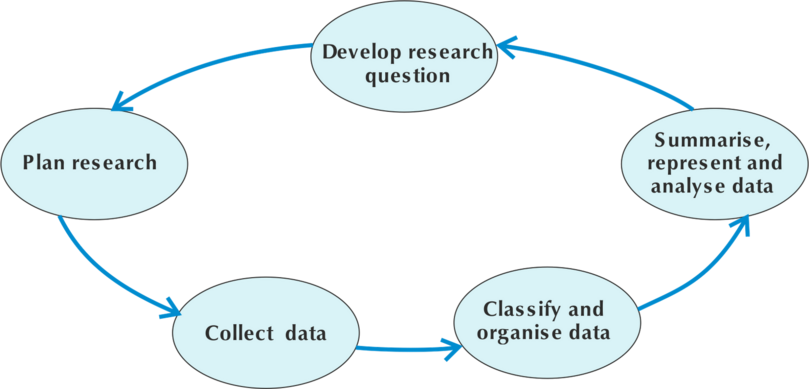
We show the process of data handling as a cycle, because once we have summarised, represented and analysed the results, we may have new questions that we need to research. Then we will need to start the cycle again.
Different ways of collecting data
The first step in any statistical process is data collection, which is gathering the facts and figures (the data).
What we are researching affects the way we collect the data. Four methods of collecting data are shown in the diagram.
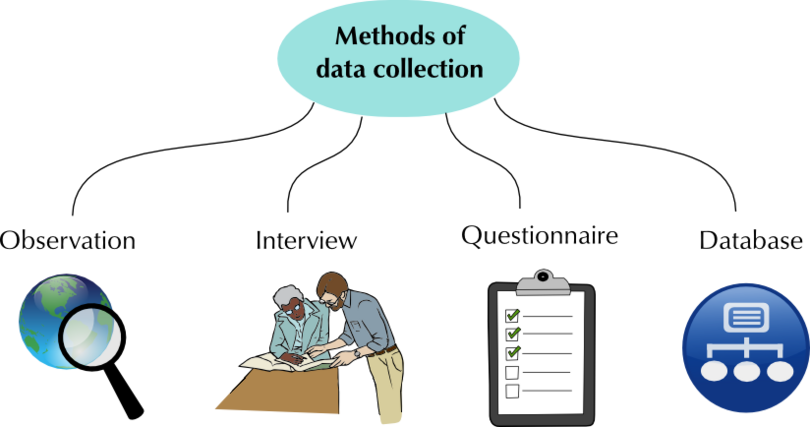
- Observation and measurement: Collecting data using observation or measurement involves looking at something that actually happens, and then measuring and recording it. An example of observation is counting the number of cars passing the gate of your school every hour. An example of measurement is measuring the masses of all the students in your class.
- Interview: An interview usually takes place between two people. One of the people is called the interviewer and the other is the interviewee or respondent. We use interviews when we can talk to the respondents directly. For example, we could interview people leaving a shop to find out whether they were happy with the way they were treated by the people working in the shop. Job and parent-teacher interviews are examples interviews that are also for collecting data, but this data is used in a way that is different from statistical use.
- Questionnaire: A questionnaire is a set of questions given to many people to complete. A questionnaire is useful for getting information from many people, as it can be handed out and then collected later, and does not need an interviewer. It is the best method of collecting data when you want to ask a large group of people what they think about a specific issue. A questionnaire should have a short explanation of what your research is about. A very special kind of questionnaire is used for a national population census, which last took place in 2012 in Nigeria.
- Database: A database is an organised collection of data that someone else has already organised and presented. Databases can be stored on a computer or on the internet, or presented in publications such as books, newspapers and magazines.
data collection Data collection is gathering the facts and figures needed for the research.
Worked example 17.1: Choosing the best way to collect data
Amaka wants to answer the following question: Is my baby crying too much? Consider which of the following would be the best method for her to use.
Should Amaka interview people one-on-one to find out the answer to her question?
Should Amaka use a questionnaire to give to groups of people to find the answer to her question?
Should Amaka observe her baby to find the answer to her question?
-
Step 1: Decide whether Amaka should interview people one-on-one to find the answer to her question.
An interview is a formal or informal conversation with another person. Another person might have an opinion, but will not be able to give a definite answer.
Answer: Interviews would not be the best method.
-
Step 2: Decide whether Amaka should give a questionnaire to a group of people to find the answer to her question.
A questionnaire has a set of clear questions, usually with a choice of answers, that is given to many people. A group of people outside the home would not be able to answer Amaka's question.
Answer: A questionnaire would not be the best method.
-
Step 3: Decide whether Amaka should observe her baby to find the answer to her question.
Observation is the best method of collecting data when you need information about the behaviour of people.
Answer: The question about Amaka's baby is better answered by watching its behaviour. So she should observe her baby and then make an informed judgement about whether it is crying too much.
Exercise 17.1: Choose the best way to collect data
-
Babangida wants to find out her classmates' favourite television programme.
What one of the following should Babangida do?
- Look up the answer in the newspaper.
- Observe everyone in her class when they are watching television.
- Draw up a questionnaire asking which of the given ten television programmes was their favourite and hand it out to her classmates to complete.
Babangida won't find out about the favourite television programme of her classmates in a newspaper.
Observing all her classmates when they watch television will be too time consuming, and won't necessarily tell her which programme is their favourite.
Answer: Babangida should draw up a questionnaire and then give it to her classmates to complete.
-
Adanna wants to know how the price of cooking oil has increased over the last ten years.
Which one of the following should Adanna do?
- Go to the Nigerian National Bureau of Statistics website and use the database that they have there which gives the price of cooking oil over the last ten years.
- Interview everyone entering a supermarket one Saturday morning and asking them what they remember about the cost of cooking oil over the last ten years.
- Draw up a questionnaire to hand out to all the students in her school asking them to ask their parents what they remember about the cost of cooking oil over the last ten years.
Answer: Adanna should go to the Nigerian National Bureau of Statistics website to find the information that she wants.
People won't remember facts like the price of cooking oil ten years ago, so interviewing everyone entering the supermarket won't give Adanna the information she wants, nor will giving students at school a questionnaire.
Organising data
After data has been collected, the next step is organising the data, by bringing it together in a systematic way that makes it easier to read. We can organise data by using tallies and frequency tables.
organising data Organising data is bringing it together in a systematic way that makes it easier to read.
Tallies
Tallies are a way of counting by drawing a short vertical line to record each item as you count it. To make reading the tally marks easier, for every fifth mark, you draw a diagonal line through the first four lines, as shown in the table below for the number 5. Then leave a space before starting on the next group of four tally marks, as shown for the numbers 8, 10 and 12.
The table below shows the tally marks for a few numbers.
3 4 5 8 10 12


The advantage of using tallies is that you can keep a running total while you are counting, and tally tables are easy to read because you can count in fives.
Here is an example of a tally table showing the numbers of cars of different colours that have been counted. Each car that is counted is shown by one tally mark.
| Car Colours | Tally |
|---|---|
| Red |  |
| Green |  |
| Blue |  |
| Yellow |  |
From these tallies, we can see that 7 red cars, 3 green cars, 4 blue cars and 2 yellow cars were counted.
Frequency tables
When we have finished counting, and add up all the tally marks, the totals tell us how many times the event occurred, which is called the frequency. So the frequency of red cars was 7, of green cars was 3, of blue cars was 4, and of yellow cars was 2.
frequency The frequency is how many times the event occurred.
A frequency table shows the list of different categories (such as colours of cars), together with the number of times each item occurs. This frequency table shows the number of differently coloured cars.
| Car colours | Frequency |
|---|---|
| Red | 7 |
| Green | 3 |
| Blue | 4 |
| Yellow | 2 |
- In the first column of a frequency table we list the categories. In this example the categories are the car colours, so they are red, green, blue and yellow.
- In the second column we record the frequency, which is the number of times each category occurs. As you can see, the frequency is the same as the number of marks we made in the tally table.
Worked example 17.2: Counting tally marks
Amina counted the number of students who belonged to the chess club, and used tally marks to show this data.
How many students belong to the chess club?

-
Step 1: Count up the tally marks.
There are 4 5 = 20 tally marks.
-
Step 2: Write your answer in a full sentence.
Answer: 20 students belong to the chess club.
Exercise 17.2: Count tally marks
-
Oladapo counted the number of students who have pets at home, and used tally marks to show this data.

How many students have pets at home?
Count up the tally marks
The number of students who have pets at home = ( ) + = .
Answer: 13 students have pets at home.
-
Adebisi counted the number of girls playing tennis, and used tally marks to show this data.

How many girls are playing tennis?
10 girls are playing tennis.
Worked example 17.3: Drawing up a frequency table
15 students each had one chance to throw a die, and they recorded the number the die landed on each time.
The list of numbers is
Work out how many of each number was thrown, and create a frequency table to show your results.
The frequency is the number of times each number was thrown.
-
Step 1: Arrange the numbers in ascending order to help you count. Cross out each number once you have counted it.
-
Step 2: Count the number of times each number was thrown, and write the total for each number in a frequency table.
| Score | Frequency |
|---|---|
| 1 | 3 |
| 2 | 3 |
| 3 | 1 |
| 4 | 2 |
| 5 | 5 |
| 6 | 1 |
Exercise 17.3: Draw up frequency tables
-
15 students each had one chance to throw a die. The number the die landed on was recorded.
The numbers were:
Work out how many of each number was thrown, and create a frequency table to show your results.
Arrange your data in order to help you count. Cross out each number once you have counted it.
Score Frequency 1 3 2 0 3 6 4 2 5 2 6 2 -
The marks out of 10 for a maths quiz are listed below. There were 20 students who took part in the quiz.
The marks were:
Work out how many students got each mark, and use the frequency table given below to show your results.
Score Frequency 5 Â 6 Â 7 Â 8 Â 9 Â 10 Â Arrange your data in order. Cross out a number once you have counted it.
Count the number of times each mark appears and write the totals in the frequency column.
Score Frequency 5 7 6 3 7 5 8 3 9 0 10 2
17.2 Summarising data
After we have collected and organised data, we need to summarise it. Summarising data allows us to see at a glance what important things the data has told us.
When we summarise data, we use different methods to sum up what the whole set of data has told us. These methods give us numbers that are called the mean, the mode and the median.
summarising data Summarising data is using the mean, the mode and the median to sum up what the whole set of data has told us.
The mean
The mean of a set of data gives the average of the data. The mean is calculated by adding all the values together and dividing by the number of values in the data set.
For example, you have these results as your data:
The mean =
Worked example 17.4: Finding the mean
Find the mean of the data set .
-
Step 1: Add the numbers.
Sum of the data values = + + + + + + + + =
-
Step 2: Count how many numbers there are in the data set.
Number of data values = 9.
-
Step 3: Find the mean by dividing the sum of the data values by the number of data values.
The mean =
The mean is 5.2.
Exercise 17.4: Find the mean of a data set
-
Consider the following set of data:
Find the mean value of the data set. Round your answer to two decimal places.
Sum of the data values = + + + + + + + =
Number of data values = 8
The mean =
The mean is 7.5.
-
What is the mean value of the following data set? Round your answer to two decimal places.
Sum of the data values = =
Number of data values = 7
Mean =
The mean is 6.86.
-
Find the mean value of the following data set. Round your answer to two decimal places.
Sum of the data values = =
Number of data values = 10
Mean =
The mean is 7.3.
The mode
The mode is the data item that occurs most often in a set of data. No calculation is needed to find the mode. You may have to sort the data, and then you count to find the value that appears most often.
For example, if you have the data set , the mode is 7, because 7 occurs three times.
As you can see, 12 is also repeated, but it is only repeated twice. If 12 were also repeated three times, you would have two modes for this data set: 7 and 12.
If no number is repeated, then there is no mode for the data set.
Worked example 17.5: Finding the mode
Find the mode of this data set: .
-
Step 1: First sort the data, writing the values in order from smallest to largest.
-
Step 2: Identify the mode, which is the value that appears the most often.
The number 7 appears twice.
The mode is 7.
Worked example 17.6: Finding the mode when there is more than one mode
Find the mode of the data set .
-
Step 1: First sort the data by writing the values in order from smallest to largest.
-
Step 2: Identify the mode.
The numbers 8, 9 and 11 all appear twice.
The modes are 8; 9 and 11.
If there are two or more modes, give all of the mode values separated by a semi-colon (;) and "and".
Exercise 17.5: Find the mode of a data set
-
Find the mode of the following set of data:
First sort the data from smallest to largest:
Many numbers appear more than once, but 1 appears five times.
The mode is 1.
-
Find the mode of the following set of data: .
The data is already sorted into ascending order.
5, 9 and 11 all appear twice.
The modes are 5; 9 and 11.
-
Find the mode of the following set of measurements:
Sorted data:
The modes are 6 m and 11 m.
-
Funeka decides to record the colours of everyone's schoolbags as they arrive at school. She makes a tally list to record the colours. Later, she uses the tallies to draw up this frequency table:
Colour of schoolbags Frequency Blue 27 Red 16 White 43 Black 7 Green 16 What colour is the mode?
The mode is the data item that appears the most often, so the mode will be the colour with the highest frequency.
The mode of this data set is white.
The median
The median is the middle value in the set of data values. To find the middle, the data set has to be arranged in ascending order first.
For example, if you have that data set , there are 7 numbers, so the fourth number, which is 5, is in the middle of the set. So the median is 5.
We need to consider two cases when we find the median of data:
- When there is an odd number of data values, as in the set above, there is a middle value.
- When there is an even number of data values, there is not a middle value, so we use the method shown in worked example 17.8.
Worked example 17.7: Finding the median of an odd number of values
Find the median of the data set: .
-
Step 1: Arrange the numbers in ascending order.
-
Step 2: Count the number of data values.
There are 11 data values, which is an odd number of data values.
-
Step 3: Find the middle value.
There are 5 numbers to the left of 4 and 5 numbers to the right of 4.
Therefore, 4 is the median of the set of the numbers.
Worked example 17.8: Finding the median of an even number of values
Find the median of the data set:
-
Step 1: Arrange the numbers in ascending order.
-
Step 2: Count the number of data values
There are 10 data values, which is an even number.
-
Step 3: Find the middle value.
There is no number in the middle position. So we take the number that is halfway between the two middle values, which are the fifth item, which is 4, and the sixth item, which is 6.
Therefore, the median is .
Exercise 17.6: Find the median of a data set
-
Find the median of the data set . If necessary, round your answer to one decimal place.
Arrange the numbers in ascending order:
There are 12 data values, so there is no number in the middle position. The two middle numbers are 8 and 9.
The median is .
-
Find the median value of the following data set: .
Ascending order:
There are 8 data values.
The median is .
-
Find the median value of the data set .
Ascending order:
The median is 7.
Quite often, you will be asked to give the mean, median and mode for the same data set.
Worked example 17.9: Finding mean, median and mode for one data set
Find the mean, median and mode for the data set .
If necessary, round your answer to two decimal places.
If there are two or more modes, give all of the mode values, separated by "and" and/or a semi-colon (;).
-
Step 1: Find the mean of the data set by adding up all the values in the data set and dividing by the number of data values.
=
-
Step 2: Find the mode by arranging the data in ascending order, and then finding the value or values that appear the most.
Arranging the data in order we get .
The mode is 9 as it appears three times.
-
Step 3: Find the median by finding the middle value in the data set.
We have 9 values: , so the median is the fifth value, which is a 9.
Answer: The mean is 8.56, the mode is 9, and the median is 9.
Exercise 17.7: Find the mean, median and mode of a data set
If necessary, round your answer to two decimal places.
-
Find the mean, median and mode for the following set of data: .
=
Ascending order:
7 is the mode as it appears three times.
The median (middle value) is 7.
Answer: The mean is 7.71, the mode is 7 and the median is 7.
-
Find the mean, median and mode for the data set .
=
Ascending order:
The modes are 6 and 9.
The median is .
Answer: The mean is 8, the modes are 6 and 9, and the median is 8.5.
17.3 Presenting data
So far we have collected the data, then organised the data, and summarised the data. Now we need to find ways to present the data, so that we can share the results of our research with other people.
There are many ways of presenting data to show results, including written reports, tables and graphs. Graphs are useful as they give a picture of the results that is easy to understand. We will use bar graphs.
presenting data Presenting data is finding a way to show results so they can be shared with other people.
Using bar graphs to present data
Bar graphs are used to display data that has been collected and organised in categories. An example of categories is the cars of different colours that we looked at earlier in this chapter.
A bar graph is a chart that uses either horizontal or vertical bars to show how categories compare with each other. The length of each bar shows the value that the bar represents.
For example, every month for five months, the manager of a new shop keeps count of how many customers visit the shop. The manager created this bar graph to show the results.
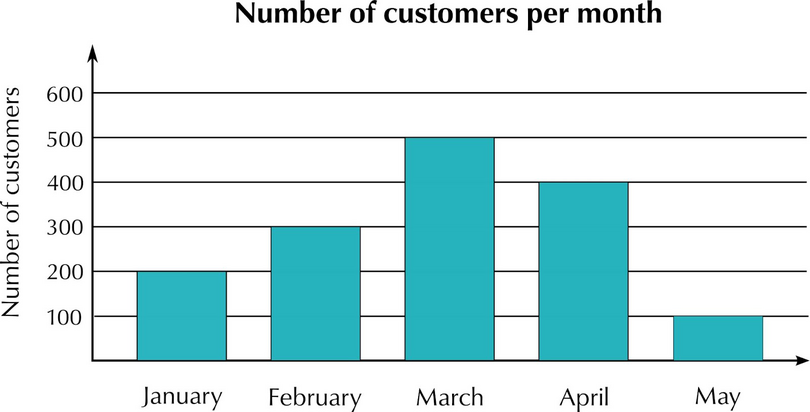
- The categories (the months) are shown along the horizontal axis.
- The frequency (the number of customers) is shown along the vertical axis.
It is important to use an appropriate interval on the graph to show the frequency.
This bar graph uses an interval of 100 along the vertical axis. If the largest frequency was only 15, an interval of 100 is not appropriate. Using an interval of 1 would not be appropriate if the maximum frequency was 500, as this would make a graph very large and hard to read.
Worked example 17.10: Reading information from bar graphs
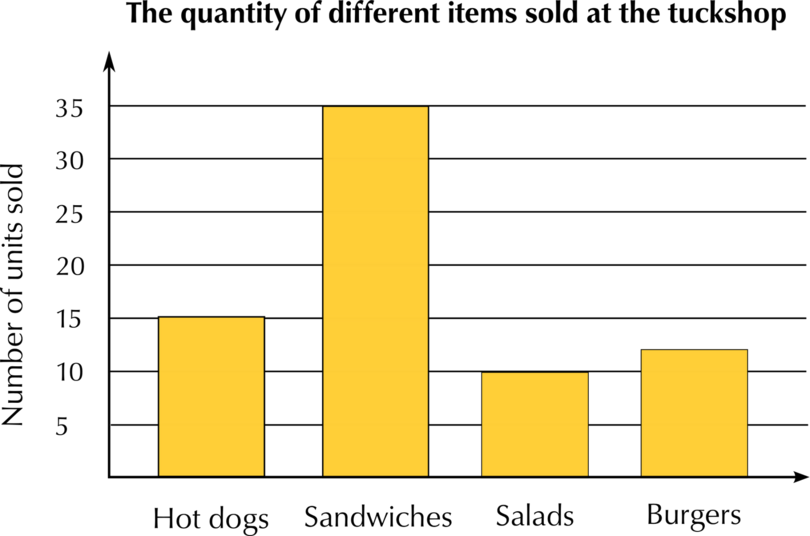
The school tuckshop staff keeps a record of how many hot dogs, sandwiches, salads and burgers they sell on one day. They draw a bar graph to represent the data.
Draw up a frequency table and complete it by reading the information off the bar graph.
-
Step 1: The categories are the types of food sold. Put the categories you see on the bar graph into the first column of the frequency table.
Categories Frequency Hot dogs  Sandwiches  Salads  Burgers  -
Step 2: Read the frequencies off the graph, and write them next to the correct category in the table.
| Categories | Frequency |
|---|---|
| Hot dogs | 15 |
| Sandwiches | 35 |
| Salads | 10 |
| Burgers | 12 |
Exercise 17.8: Read information off bar graphs
-
School A started a recycling project. The bar chart below shows the number of kilograms of each category School A recycled last week.
School A's recycling
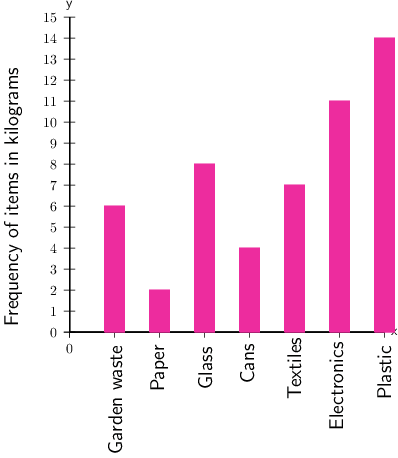
- Of which item did the school collect the most, in kilograms?
Find the category for which the school collected the most by finding the highest bar on the bar graph.
From the graph, we can see that more kilograms of plastic were collected than any other category. This is represented by the highest bar, which is 14Â kg.
Answer: In kilograms, the item collected the most was plastic.
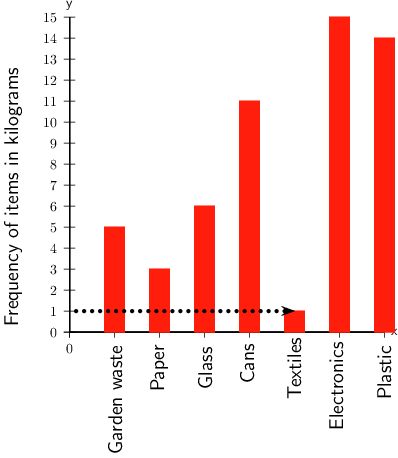
- For which item did the school collect 7Â kg?
To find the answer to the second question, you need to focus on the vertical axis, which shows the frequency of items in kilograms.
This means that you need to find 7 on the vertical axis.
Follow a horizontal line across (you can use a ruler) until you reach the bar that corresponds with that value, which is textiles.
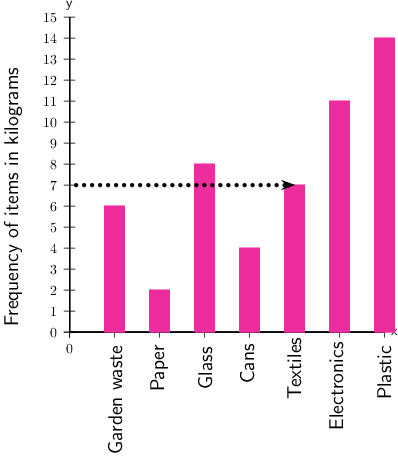
Answer: The school collected 7Â kg of textiles.
- Of which item did the school collect the least, in kilograms?
Find the category with the shortest bar.
We see that the shortest bar has a measurement of 2Â kg, and it is for the category of paper.
Answer: In kilograms, the item collected the least was paper.
-
School B also started a recycling project. The bar chart below shows the number of kilograms of each category School B recycled last week.
School B's recycling
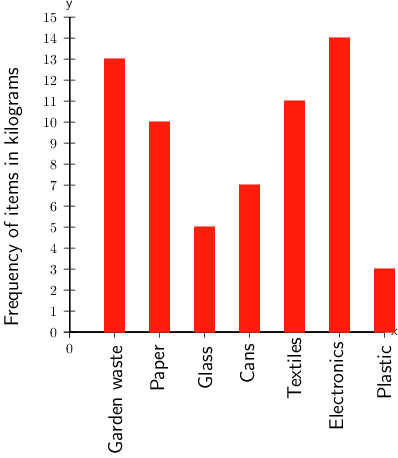
- Of which item did the school collect the most, in kilograms?
The tallest bar is 14Â kg for electronics.
Answer: In kilograms, the item collected the most was electronics.
- For which item did the school collect 13Â kg?
The bar that corresponds with 13Â kg is garden waste.
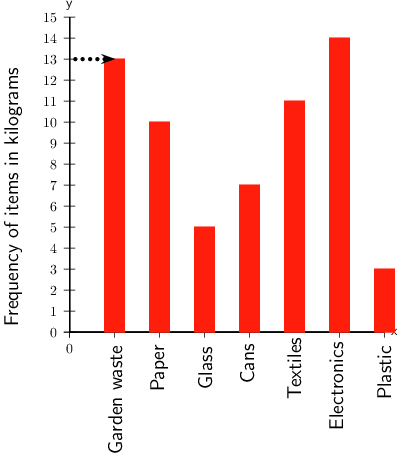
Answer: The school collected 13Â kg of garden waste.
- Of which item did the school collect the least, in kilograms?
The shortest bar has a measurement of 3Â kg, and corresponds with plastic.
Answer: In kilograms, the item collected the least was plastic.
-
School C also started a recycling project. The bar chart below shows the number of kilograms of each item School C recycled last week
School C's recycling
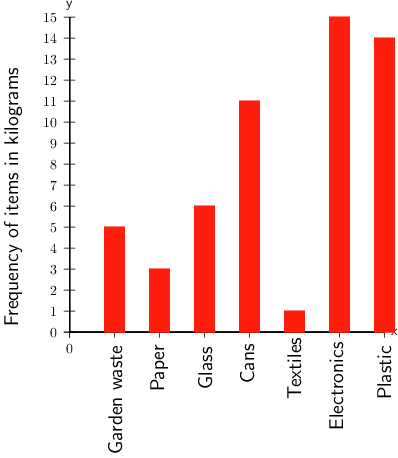
- Of which item did the school collect the most, in kilograms?
The tallest bar is 15Â kg for electronics.
Answer: In kilograms, the item collected the most was electronics.
- Which item did the school collect 1Â kg of?
Find the value of 1 on the vertical axis, and the bar that corresponds with that value.
The school collected 1Â kg of textiles.
- Of which item did the school collect the least, in kilograms?
In kilograms, the item collected the least was textiles.
17.4 Summary
- Collecting, organising and presenting data forms part of the data handling cycle.
- Data can be collected using observations, interviews, questionnaires and existing databases.
- The method chosen for collecting the data depends on the type of research being done.
- Organising data is bringing it together in a systematic way that makes it easier to read.
- Data can be organised using tallies and frequency tables.
- Tallies are a way of counting by drawing a short vertical line to record each item as you count it. For every fifth mark, you draw a diagonal line through the first four lines.
- The frequency is how many times an event occurred.
- A frequency table shows the list of different categories, together with the number of times each category occurs.
- We summarise data by finding one or two numbers that sum up the whole set of data, using the mean, median and
mode.
- The mean gives the average, and is calculated by adding all the values together and dividing by the number of values in the data set.
- The mode is the data item (or items) that occurs most often in a set of data.
- The median is the middle value in a set of data values.
- Presenting data is finding a way to show results so they can be shared with other people.
- Bar graphs are used to present data that is compared in categories.