Chapter 16: Need for statistics
16.1 The purposes of statistics
Statistics keeps us informed about what is happening in the world around us. Some examples of how statistics are useful are listed below.
- Weather information is given in the newspapers, on the radio, on the television and on the internet. Scientists use statistics to compare previous weather with the current weather, and to then predict future weather in a particular area.
- Statistics play an important part in financial businesses. Traders and people in business use statistics to decide how they should invest and make money.
- Statistics play an important role in the development of new medicines. The new medicines have to be tested and results have to be recorded in order to see if these new medicines actually do help in the way they are supposed to, and if they have bad side-effects.
- News reporters make predictions of winners for elections based on statistics collected about how people are going to vote.
- Statistical concepts are used in quality testing in factories and manufacturers. Companies make many products each day, but it is impossible to test each one to make sure that it works correctly. So they test samples of the products, and carry out statistical work on those results. If a sample works correctly, they can say that there is a good statistical probability that all the products work correctly.
Statistical data
The first step in doing statistical work is to decide what it is you want to find out about. The next thing you do is plan how you are going to gather enough information so you can find out what you want to know. The information used in statistics is called data.
Once your planning is complete, you begin to gather the information, which in statistics is called collecting data.
Examples of data that you could collect about yourself, your friends or your family are:
- where different people live
- what different people eat for breakfast
- people's favourite fruit
- people's ages, heights or masses
- the number of siblings (brothers and sisters) that people have
- which size shoe people wear.
Once you have collected the data, you can put it in a table, so it is easier to read and understand. Having the data organised in a table makes it easier to see what the data tells you, and to answer questions about the data. This is called analysing data.
If data is collected from a number of people, we say that we have surveyed the people. We "do a survey" to collect information from the people, such as where all the students in a school live.
data Data is information in the form of facts, such as numbers, measurements or observations.
collecting data Collecting data is gathering together and recording the information needed.
analysing data Analysing data is making sense of the data to see what it tells you.
Worked example 16.1: Analysing data given in a table
A researcher wanted to compare the numbers of female and male teachers at different schools. She did a survey to find out the number of male and female teachers there were in six different schools. She recorded the results in this table.
| Â | School A | School B | School C | School D | School E | School F |
|---|---|---|---|---|---|---|
| Male teachers | 18 | 8 | 9 | 3 | 9 | 5 |
| Female teachers | 11 | 2 | 10 | 4 | 15 | 6 |
How many teachers were there at School A?
How many teachers were there at School D?
Which school had the most male teachers?
Which school had the most female teachers?
Arrange the schools in order of most teachers to fewest teachers.
-
Step 1: Find the column headed School A. Add together the number of male teachers and the number of female teachers.
Number of teachers at School A =
Answer: 29
-
Step 2: Find the column headed School D. Add together the number of male teachers and the number of female teachers.
Number of teachers at School D =
Answer: 7
-
Step 3: Look along the row marked Male teachers and find the column with the largest number in it.
There are 18 male teachers at School A, which is more than the number of male teachers at any other school.
Answer: School A
-
Step 4: Look along the row marked Female teachers and find the column with the largest number in it.
There are 15 female teachers at School E, which is more than the number of female teachers at any other school.
Answer: School E
-
Step 5: Add up the number of male teachers and female teachers at each school. Then arrange the schools in order from most to fewest teachers.
School A = teachers
School B = teachers
School C = teachers
School D = teachers
School E = teachers
School F = teachers
You could start by arranging the number of teachers in order from the biggest to the smallest number, and then use this order to arrange the schools in order.
Number of teachers from largest to smallest: 29; 24; 19; 11; 10; 7
Answer: School A; School E; School C; School F; School B; School D
Exercise 16.1: Analyse data given in a table
-
You surveyed the students in your class at school to find out whether they preferred fruit juice, lemonade, orange fizz or cola.
The table shows the results of your survey.
Drink Students fruit juice 12 lemonade 10 orange fizz 11 cola 7 -
How many students took part in the survey?
Number of students who took part in the survey =
-
Which drink was preferred by the largest number of students in your class?
The largest number in the second column = 12
Fruit juice was preferred by the largest number of students.
-
Which drink was preferred by the smallest number of students in your class?
The smallest number in the second column = 7.
The smallest number of students preferred cola.
-
Arrange the drinks in rank order. Rank order means from the one preferred by the largest number to the one preferred by the smallest number.
Numbers from biggest to smallest: .
The drinks in rank order are fruit juice; orange fizz; lemonade; cola.
-
-
The students in your class were surveyed to find out what size shoe they wear.
The results were organised into the following table.
Shoe size Total number 4 7 5 9 6 5 7 11 8 3 9 1 -
Which shoe size is worn by the most students in your class?
The largest number in the second column for total number is 11 students.
A size 7 shoe is worn by the most students.
-
Which shoe size is worn by the fewest students in your class?
The smallest number in the second column is 1 student.
A size 9 shoe is worn by the fewest students.
-
How many students took part in the survey?
Number of students that took part in the survey =
-
Arrange the shoe sizes in rank order (from the shoe size worn by the most students to the shoe size worn by the fewest students).
Number of students wearing each size in rank order: .
The shoe sizes in rank order: size 7; size 5; size 4; size 6; size 8; size 9.
-
Sources of statistical information
One source of statistical information would be the results of a survey. A second source of statistical information is the newspaper and another source of statistical information is the internet.
- Suppose we wanted information about the ages of the people in Nigeria. We could source this information from the Nigerian National Bureau of Statistics website at https://www.nigerianstat.gov.ng/.
- Suppose we wanted to know what the top eight causes of death were in Nigeria. We could source this information from the Nigerian Centre for Disease Control and Prevention website at https://www.ncdc.gov.ng/.
- Suppose we wanted to find out about the status of voter education, especially who is allowed to vote in the next elections, we could source the information from the Independent National Election Commission website at https://www.inecnigeria.org/voter-education/.
- Suppose we wanted to find out about our rights as a customer in a bank, we could source this information from Central Bank of Nigeria website on https://www.cbn.gov.ng/Supervision/cpdconedu.asp.
Worked example 16.2: Analysing statistical data about age groups
Erioluwa found the following information about the Nigerian population on the Nigerian National Bureau of Statistics website. The table gives statistics about the percentage of the Nigerian population in the given five age groups in 2012 and 2018.
Year 0 to 14 years 15 to 24 years 25 to 54 years 55 to 64 years 65 years and older 2012 43.8% 19.3% 30.1% 3.8% 3% 2018 42.5% 19.8% 30.4% 4.0% 3.3% Use the table to answer the following questions.
Arrange the age groups in 2012 in ascending order (from smallest to largest).
Arrange the age groups in 2018 in ascending order. Comment on any differences in the rankings.
In 2012 the population of Nigeria was approximately 166.2 million. How many Nigerians fell into the 0 to 14 year age group?
In 2018 the population of Nigeria was approximately 200.96 million. How many Nigerians fell into the 0 to 14 age group? Comment on any differences in the figures.
-
Step 1: Arrange the 2012 percentages in ascending order and then use the percentages to arrange the age groups in ascending order.
Percentages in ascending order in 2012: 3%; 3.8%; 19.3%; 30.1%; 43,8%
Answer: 65 years and older; 55 to 64 years; 15 to 24 years; 25 to 54 years; 0 to 14 years.
-
Step 2: Arrange the 2018 percentages in ascending order and then use the percentages to arrange the age groups in ascending order.
Percentages in ascending order in 2018: 3.3%; 4.0%; 19.8%; 30.4%; 42.5%
Answer: 65 years and older; 55 to 64 years; 15 to 24 years; 25 to 54 years; 0 to 14 years.
The percentages of the population in each age group have changed slightly over the six years, but the order of the age groups has not changed.
-
Step 3: Find the percentage of Nigerians that fell into the 0 to 14 year age group in 2012, and then find that percentage of 166.2 million Nigerians.
Percentage of the population in 2012 that fell into the 0 to 14 age group = 43.8%
Answer: Number of Nigerians that fell into the 0 to 14 age group in 2012 = 43.8% 166.2 million = 72.7956 million
-
Step 4: Find the percentage of Nigerians that fell into the 0 to 14 year age group in 2018 and then find that percentage of 200.96 million Nigerians.
Percentage of the population in 2018 that fell into the 0 to 14 age group = 42.5%
Answer: Number of Nigerians that fell into the 0 to 14 age group in 2018 = 42.5% 200.96 million = 85.408 million
Although the percentage of the Nigerian population that fell in the 0 to 14 age group decreased from 2012 to 2018, the actual number of Nigerians in this age group increased from 72.7956 million to 85.408 million.
Exercise 16.2: Analyse statistical data given in a table
-
Chidi sourced information about the top eight causes of death in Nigeria from a survey published by the Centre for Disease Control and Prevention in 2013. The following table shows the results.
Reason for death Percentage of total number of deaths in 2012 Malaria 20% Chest infections 19% HIV and Aids 9% Diarrhoea 5% Road accidents 5% Malnutrition 4% Cancer 3% TB 2% Use the table to answer the following questions.
- What percentage of deaths in 2012 were due to road accidents?
Percentage of deaths in 2012 due to road accidents = 5%
- In 2012, what was the difference in the percentage of deaths that were caused by chest infections and by cancer?
Difference between the percentage of deaths in 2012 caused by chest infections and cancer = 19% 3% 13%
- Approximately 2,500,000 Nigerians died during 2012. How many of these Nigerians died from malaria?
Number of people who died from malaria in 2012 = 20% of 2,500,000 = 500,000
-
Abiodun wanted to know how the Lion, Leopard and Elephant Football teams were doing in the Nigerian Football League. He found the following table of results in the newspaper:
Team Matches played Won Drawn Lost Goals for Goals against Points Lions 22 12 4 6 23 18 40 Leopards 22 8 11 3 22 18 35 Elephants 22 8 9 5 22 13 33 The points are calculated as follows:
Win: 3 points
Draw: 1 point
Loss: 0 pointsUse the table to answer the following questions.
- Which team won the most games?
The Lions team won 12 of 22 games, so it won the most games.
- Which team drew more games?
The Leopards team drew 11 of 22 games, so it drew the most games.
- Which team lost the most games?
The Lions lost 6 of 22 games, so it lost the most games.
- Which team won the League?
The Lions team had the most points, so it won the League.
- For each team, do the won, drawn and lost games add up to the matches played?
Lions: 12 4 + 6 22
Leopards: 8 11 + 3 22
Elephants: 8 9 + 5 22
Yes, the won, drawn and lost games for each team add up to 22, which is the number of games played.
- Show how the Elephants points were calculated.
Elephants points = ( ) + ( ) + ( ) =
- For every game the Lions lost, how many did the team win?
The ratio of the number of games lost to the number of games won = .
For every game the Lions team lost, it won two games.
16.2 Introduction to probability
Probability is the study of the laws of chance. It is about how probable or how likely it is that something will happen.
We often use the word "chance" when we are talking about probability, for example, "I have no chance of winning the prize!".
Examples of other statements that try to predict how likely an event will happen are:
- "I am sure it will never happen."
- "It might hail today."
- "She is unlikely to visit tomorrow."
The probability scale
To describe the probability that something will happen, we can use a probability scale.
The probability scale is a line that starts with impossible events at the left-hand end, and ends with certain events at the right-hand end.
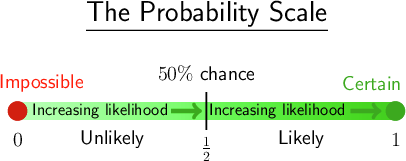
All probabilities must fall somewhere on this line.
- An event that is described as impossible is one that we know will never happen, such as having 8 days in one week. An event that is impossible is given a probability of 0.
- An event is described as certain if we know that it will definitely happen, such as having a Monday in a week. An event that is certain is given a probability of 1.
- Between the two ends of the line are word descriptions and decimals, such as:
- very unlikely (a probability of 0.2)
- unlikely (a probability of 0.4)
- 50% chance, which means an equal chance that two things will happen (a probability of 0.5)
- likely (a probability of 0.6) and very likely (a probability of 0.8).
Worked example 16.3: Using the probability scale to describe probability
Use the probability scale to find a word description for each of the events listed below.
What are the chances of someone winning the lottery if he buys a ticket every week for two months?
How likely is it that the sun will rise tomorrow morning?
What are the chances of a pregnant woman having a female child or a male child?
-
Step 1: The chance of winning the lottery is extremely small, no matter how often one buys tickets. Choose a word description from the scale that describes this.
It is highly unlikely that this person will win the lottery.
-
Step 2: The sun will definitely rise tomorrow morning. Choose the best word from the scale that describes this.
It is certain that the sun will rise tomorrow morning.
-
Step 3: Choose a word description from the scale that describes this.
There is a 50% chance (or you could say an equal chance) of a pregnant woman having a female or a male child.
Exercise 16.3: Use the probability scale to describe probability
Use the probability scale to give each of these events a word description from the scale.
-
The player will throw a number smaller than 7 on an ordinary die.
It is certain that the player will throw a number smaller than 7 on an ordinary die.
-
It will rain tomorrow in the Sahara Desert.
It is very unlikely that it will rain tomorrow in the Sahara Desert.
-
I am 2 years old and I own a motor car.
It is very unlikely that someone will be 2 years old and will own a motor car.
-
When I toss a coin, it will land on heads.
There is a 50% chance that the coin will land on heads. It is just as likely to land on tails.
-
The day after Tuesday is Wednesday.
It is certain that the day after Tuesday is Wednesday.
-
In a particular calendar year, June always comes before March.
It is impossible that June will come before March in a particular calendar year.
16.3 Practical applications
Using statistics for predictions
We can use statistics to help us with the planning of a project or or a task. It can help us with financial decisions or with buying the correct stock for a business.
Writing statistics in a table often helps when it comes to making predictions.
Worked example 16.4: Using a table to predict and plan
Adija sells Agege bread in large loaves and small loaves from her stall. Every day, she buys 24 large loaves and 24 small loaves from the bakery.
Adija finds that she has several loaves of bread each day that she has not sold.
She decides to record the numbers of large loaves and small loaves that she sells every day for a week. She wants to use this table to guide her as to how many of each size loaf she should buy in future.
Size Mon Tues Wed Thurs Fri Sat Sun Large 20 18 19 16 19 18 20 Small 24 21 22 24 20 20 24 Use the table to answer the following questions.
How many large loaves did Adija sell altogether in that week?
How many small loaves did Adija sell altogether in that week?
During that week, did Adija sell more large loaves or small loaves?
During that week, what was the maximum number of large loaves sold on one day?
During that week, what was the maximum number of small loaves sold on one day?
Of which size loaf should Adija buy fewer?
-
Step 1: Add the number of large loaves sold.
Number of large loaves sold = 20 + 18 + 19 + 16 + 19 + 18 + 20 = 130
-
Step 2: Add the number of small loaves sold.
Number of small loaves sold = 24 + 21 + 22 + 24 + 20 + 20 + 24 = 155
-
Step 3: Compare the number of large loaves sold and the number of small loaves sold, and say which total is greater.
Adija sold more small loaves than large loaves.
-
Step 4: Look along the row showing large loaves and give the maximum number sold on a day.
Maximum number of large loaves sold on a day = 20
-
Step 5: Look along the row showing small loaves and give the maximum number sold on a day.
Maximum number of small loaves sold on a day = 24
-
Step 6: Compare the maximum number of large loaves sold and the maximum number of small loaves sold, and say which one Adija should buy fewer of.
Adija should buy fewer large loaves.
From the answers to the questions, we can see that the bread seller's statistical record of her sales helped her plan the number of loaves of bread to buy. This will help her not to spend money on loaves she does not sell, so it will help her to maximise the amount of money she makes from selling bread.
Exercise 16.4: Use statistics given in a table to predict and plan
-
A stationery shop kept a record of the number of exercise books it sold in a week, as well as the total profit it made on the sale of these exercise books.
Exercise book size Numbers sold Profit made on the sale of each book (in ₦) 60 pages 100 5 90 pages 20 7 120 pages 40 9 Use the table to answer the following questions.
- Rank the size of the exercise books in order of the numbers sold.
Ranked in numbers sold: 100; 40; 20
Size of exercise books ranked in numbers sold: 60 pages; 120 pages; 90 pages.
- What is the total profit made on the sale of 60-page exercise books?
Total profit made on the sale of 60-page exercise books = \(\text{100}\times{₦5} = \text{₦500}\)
- What is the total profit made on the sale of 90-page exercise books?
Total profit made on the sale of 90-page exercise books = \(\text{20}\times{₦7} = \text{₦140}\)
- What is the total profit made on the sale of 120-page exercise books?
Total profit made on the sale of 120-page exercise books = \(\text{40}\times{₦9} = \text{₦360}\)
- On which size exercise book did the stationery shop make the biggest profit?
The stationery shop made the biggest profit on the 60-page exercise books.
- If the stationery shop had to stop stocking one of the exercise books, which one should it stop stocking?
The stationery shop makes the smallest profit on the 90-page exercise books, as it sells the fewest of them. So it should stop stocking the 90-page exercise book.
-
This table shows some of the items sold in the local shop on a particular day, the number of each item sold that day, the price per item and the total amount earned that by the item.
Items sold Number sold Price/item in ₦ Amount earned in ₦ 1 litre milk 12 820 1 kg rice 20 700 12 eggs 15 600 1 kg bananas 22 500 500 g cheese 9 600 - Arrange the items in descending order, from the largest number sold to smallest number sold.
Numbers sold in descending order: 22; 20; 15; 12; 9
Items sold in descending order: bananas; rice; eggs; milk; cheese
- From which item sold did the shop keeper earn the most money?
The shop keeper earned the most money from rice.
- From which item sold did the shop keeper earn the least money?
The shop keeper earned the least money from cheese.
- The shop keeper decides to stop selling one of the items that she has been selling. Which item should she stop selling?
The shopkeeper sells the fewest items of cheese and earns the least money from selling the cheese, so she should probably decide to stop selling cheese.
16.4 Summary
- Statistics keeps us informed about what is happening in the world around us.
- Statistics can be given in table form. We can analyse these statistics in order to draw conclusions about the information given.
- Governments use statistics to make decisions about planning and where to spend their money best.
- Probability involves the study of the laws of chance.
- We can use the probability scale to give word descriptions or decimals that describe the probability of something occurring.
- We can use statistics to help us with the planning of a project or or a task. It can help us with financial decisions or with buying the correct stock for a business.
- Writing statistics in a table often helps when it comes to making predictions.