Chapter 12: Data presentation
If we use statistics to find out information about something, then process the results so we can present them, we complete the following steps:
- We develop a research question and use it to collect data.
- We classify and organise the data that we have collected.
- We then summarise the data using measures of central tendency and measures of spread.
- Once we have collected the data, classified and organised it, and then summarised it, we need to present the data and interpret the data graphically.
One way of representing data graphically is by using a pie chart.
12.1 Pie charts
You have learnt how to represent data on pie charts, and to interpret the information given on a pie chart. In this chapter, you will learn more about pie charts, and compare pie charts.
A pie chart is a circular diagram used to display data. It shows how the data are divided into groups, and it looks like a pie cut into slices.
pie chart A pie chart is a circle that is divided into sectors, with each sector showing the size of one category of the data.
Reading information from pie charts
A pie chart can make it easy to compare groups in the data.
- The whole pie chart stands for the whole amount of data being dealt with.
- Each slice or sector stands for a named part of the data. The size of each sector shows the size of that part of the data.
Worked example 12.1: Reading information from pie charts
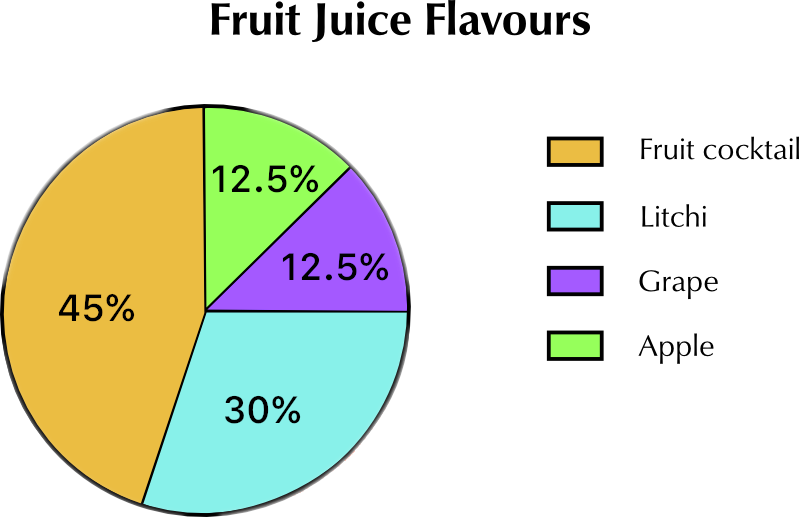
120 students were surveyed to find out which they preferred out of four different fruit juices. A pie chart was drawn to represent the data.
- Which fruit juice is the mode?
- Calculate how many students chose each type of juice.
You may use a calculator for the calculations in this chapter. If you carry out the calculations by working with fractions, remember to simplify the fractions and expressions as far as possible to make the calculations simpler, as shown below.
-
Step 1: Decide which fruit juice is the mode.
Remember that the key for the pie chart is the list of juices at the right-hand side. The colour for each juice in the key corresponds with the colour used in the pie chart sector for that fruit juice.
The mode is the data item that occurs most often, so the mode is the largest sector on the pie chart.
Fruit cocktail is the mode.
-
Step 2: Calculate how many students chose fruit cocktail.
Number of students that chose fruit cocktail = 45% of 120 students.
\begin{align} & \frac{45}{100} \times 120 \\ =&\ \frac{45}{10} \times 12 \\ =&\ \frac{9}{2} \times 12 \\ =&\ 9 \times 6 \\ =&\ 54 \\ \end{align}54 students chose fruit cocktail.
-
Step 3: Calculate how many students chose litchi juice.
Number of students that chose litchi juice = 30% of 120 students.
\begin{align} & \frac{30}{100} \times 120 \\ =&\ \frac{3}{10} \times 120 \\ =&\ \frac{3}{1} \times 12 \\ =&\ 36 \\ \end{align}36 students chose litchi juice.
-
Step 4: Calculate how many students chose grape juice and how many students chose apple juice.
The percentage of the students that chose grape juice and apple juice is the same, 12.5%, so you only need one calculation.
\begin{align} & \frac{12.5}{100} \times 120 \\ =&\ \frac{12.5}{10} \times 12 \\ =&\ \frac{150}{10} \\ =&\ 15 \\ \end{align}15 students chose grape juice and 15 students chose apple juice.
-
Step 5: Check your answers by adding the numbers of students together.
Number of students that chose each type of drink =
The answers are correct as 120 is the number of students surveyed.
Exercise 12.1: Read information from pie charts
You may use a calculator to carry out the calculations for this exercise.
-
The results for one examination taken by 400 students in JSS3 were analysed, and a pie chart was drawn to illustrate the symbols the students received.
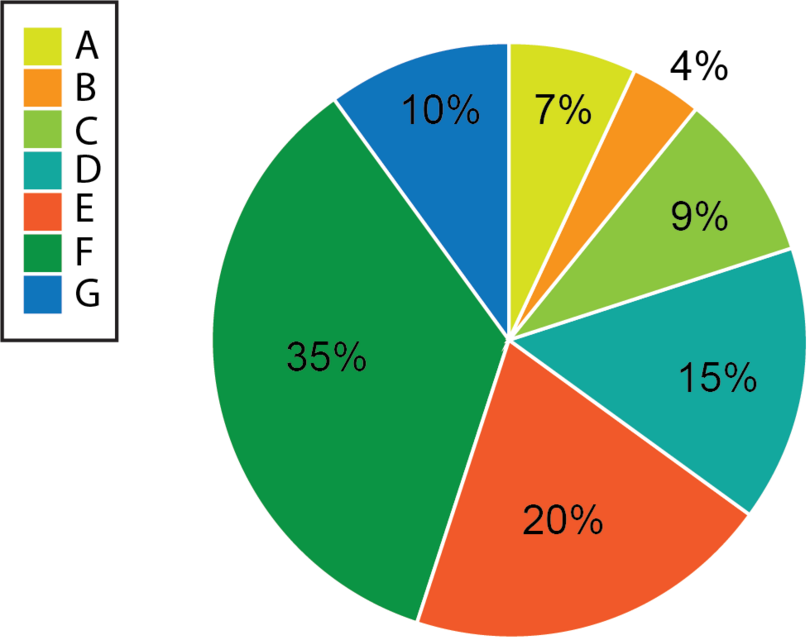
- What symbol was the mode?
The mode is the largest sector on the pie chart. The largest sector is for 35%, which is for the symbol F.
F is the mode.
- Calculate how many students received each symbol from A to G. Check that your calculations are correct by adding the answers at the end in order to see if they total 400.
Calculate how many students received each symbol by reading the percentage of students that got each symbol off the pie chart, and then converting the percentage to the number of students.
If you are not using a calculator, you can use the calculation method used to calculate the number of students that received an A for calculating all the other symbols.
- A = 7% of 400 students = = 28 students
- B = 4% of 400 students = 16 students
- C = 9% of 400 students = 36 students
- D = 15% of 400 students = 60 students
- E = 20% of 400 students = 80 students
- F = 35% of 400 students = 140 students
- G = 10% of 400 students = 40 students
Finally, check your answers by adding the number of students together and making sure the total comes to 400.
Number of students that received each symbol =
-
200 people were interviewed to find out what kinds (or genres) of movies they prefer watching. A pie chart was drawn to illustrate the data collected.
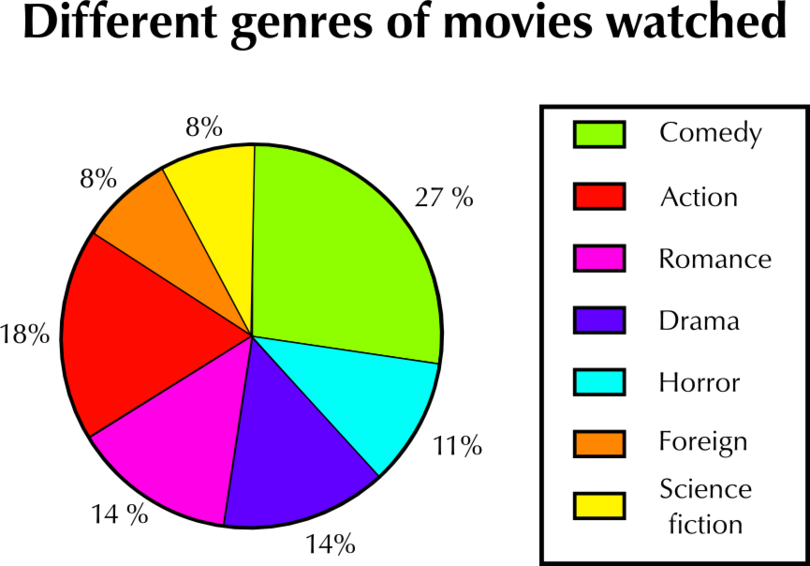
Study the pie chart and answer the questions that follow.
- What kind of movie was the mode?
The mode was comedy movies.
- What percentage of the people interviewed preferred this kind of movie?
27% of the people who were interviewed preferred watching the mode (comedy movies).
- Two pairs of movie genres were preferred by the same percentage of the people interviewed. Which two pairs of genres were these?
Two of the sectors are marked 14%, and two of the sectors are marked 8%.
One pair of movie genres preferred by the same percentage of people is Romance and Drama (14%), and the other pair is Foreign and Science Fiction (8%).
- How many of the 200 people interviewed preferred to watch action movies?
18% preferred to watch action movies.
Number of people that preferred to watch action movies = 18% of 200 people = 18 2 = 36 people
36 people preferred to watch action movies.
- How many of the 200 people interviewed preferred to watch science fiction movies?
8% preferred to watch science fiction.
Number of people that preferred to watch science fiction movies = 8% of 200 people = 8 2 = 16 people
16 people preferred to watch science fiction.
- Write the number of people that prefer action movies and the number of people that prefer science fiction movies as a ratio in its simplest form.
The ratio of the number of people that prefer action movies to the number of people that prefer science fiction movies:
=
Calculating missing sizes of sectors of a pie chart
You can use the fact that the percentages on a pie chart add up to 100% to find the missing size of a sector of a pie chart.
Worked example 12.2: Finding the size of a sector of a pie chart
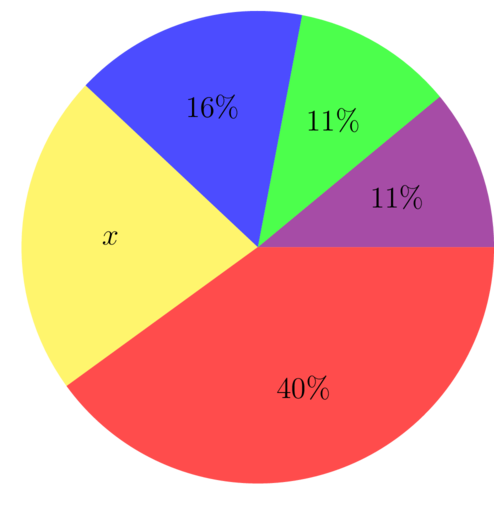
You are given the following pie chart.
- Calculate the missing value represented by .
- Which sector is the mode?
-
Step 1: Use your knowledge of percentages and equations to find the value of .
If we add up the percentages for all the sectors, the total will be 100%.
\begin{align} x + 16\% + 11\% + 11\% + 40\% & = 100\% \\ x + 78\% & = 100\% \\ x & = 100\% - 78\% \\ x & = 22\% \end{align} -
Step 2: Bearing in mind that you now have the value of , find the sector that is the mode.

The mode of the pie chart is the largest sector, because this is the data item that appears most often.
Mode: 40%
Exercise 12.2: Find the size of a sector of a pie chart
-
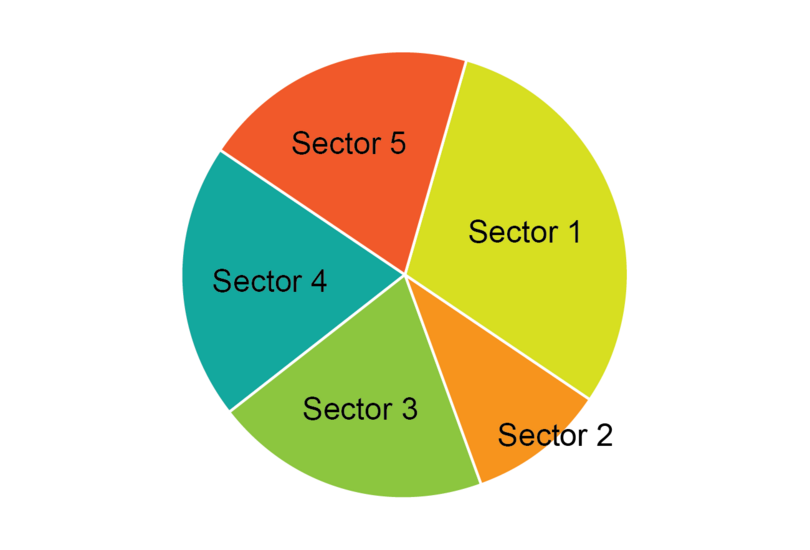
You are given the following pie chart.
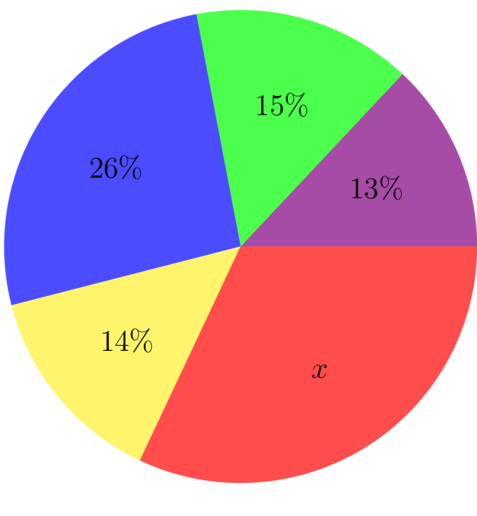
- Calculate the missing value represented by .
To find the missing value, use the fact that the sum of the percentages on the sectors is equal to 100%.
\begin{align} x + 13\% + 15\% + 26\% + 14\% & = 100\% \\ x + 68\% & = 100\% \\ x & = 100\% - 68\% \\ x & = 32\% \end{align}Answer: = 32%
- Which sector is the mode?
Now that you have the value of , find the sector that is the mode.
Mode: 32%
-
You are given the following pie chart.
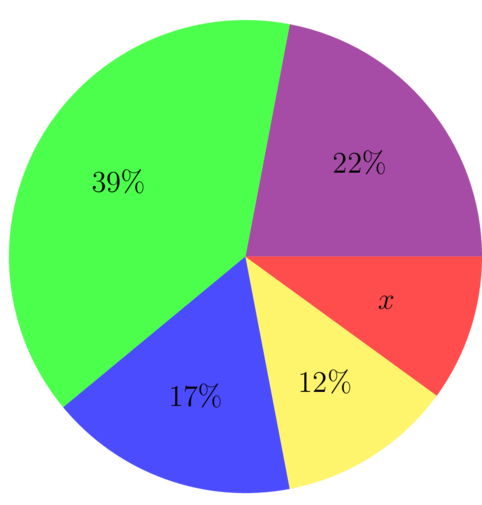
- Calculate the missing value represented by .
\begin{align} x + 22\% + 39\% + 17\% + 12\% & = 100\% \\ x + 90\% & = 100\% \\ x & = 100\% - 90\% \\ x & = 10\% \end{align}
Answer: = 10%
- Which sector is the mode?
Now that you have the value of , find the sector that is the mode.
Mode: 39%
Find the angles at the centre of a pie chart
You can use the percentage given on a pie chart to work out the angle of each sector at the centre of a pie chart.
There are at the centre of a circle.

This means that if we add up the sizes of all the angles at the centre of the pie chart, we get .
Worked example 12.3: Finding the angles at the centre of a pie chart
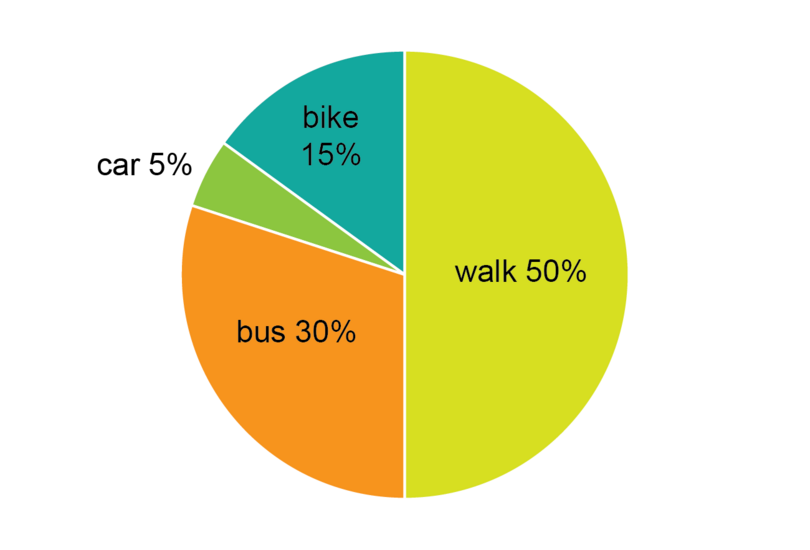
JSS3 students were surveyed to find out how they usually get to school. The pie chart provided illustrates the results of the survey.
In order to create the pie chart, the researchers who did the survey had to find the angle at the centre of the pie chart for each sector.
- What is the angle at the centre for walking to school?
- What is the angle at the centre for getting to school by bus?
- What is the angle at the centre for getting to school by car?
- What is the angle at the centre for getting to school by by bike?
You may use a calculator for the calculations in this chapter. If you carry out the calculations by working with fractions, remember to simplify the fractions and expressions as far as possible to make the calculations simpler, as shown below.
-
Step 1: To find the angle at the centre for the sector for the students who walk, first identify the percentage, and then convert the percentage to the number of degrees.
50% of the students walked, so the angle at the centre = 50% of .
\begin{align} & \frac{50}{100} \times 360 \\ =&\ \frac{1}{2} \times 360 \\ =&\ 180 \end{align}The angle at the centre for walking is .
-
Step 2: Identify the percentage for students who take a bus, and then convert the percentage to the number of degrees.
30% of the students got to school by bus, so the angle at the centre = 30% of .
\begin{align} & \frac{30}{100} \times 360 \\ =&\ \frac{3}{1} \times 36 \\ =&\ 108 \end{align}The angle at the centre for taking a bus is .
-
Step 3: Identify the percentage for students who get to school by car, and then convert the percentage to the number of degrees.
5% of the students got to school by car, so the angle at the centre = 5% of .
\begin{align} & \frac{5}{100} \times 360 \\ =&\ \frac{5}{10} \times 36 \\ =&\ \frac{1}{2} \times 36 \\ =&\ 18 \end{align}The angle at the centre for getting to school by car is .
-
Step 4: Identify the percentage for students who get to school by bike, and then convert the percentage to the number of degrees.
15% of the students got to school by bike, so the angle at the centre = 15% of .
\begin{align} & \frac{15}{100} \times 360 \\ =&\ \frac{15}{10} \times 36 \\ =&\ \frac{3}{2} \times 36 \\ =&\ 54 \end{align}The angle at the centre for getting to school by bike is .
-
Step 5: Check that your calculations are correct by adding all the angles together.
Angles at the centre =
The calculations are correct, because the total is ..
Exercise 12.3: Find the angles at the centre of a pie chart
You may use a calculator to carry out the calculations for this exercise, or use the method shown above for working out percentages with fractions.
-
The nutritional information of a plantain pancake is shown in the following pie chart.
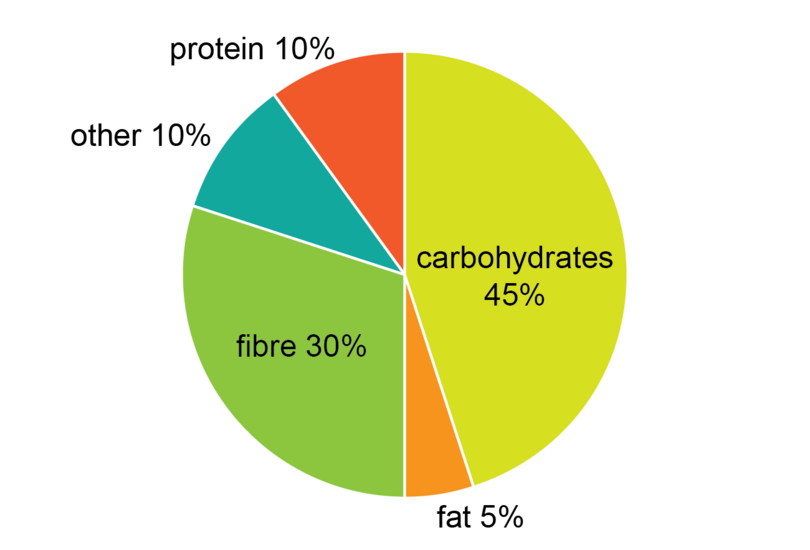
In order to draw the pie chart, the nutritionist had to find the angle at the centre of the pie chart for each sector.
- What is the angle at the centre for carbohydrates?
Identify the percentage for carbohydrates, and then convert the percentage to the number of degrees.
45% is carbohydrates.
Angle at the centre = 45% of
The angle for carbohydrates is .
- What is the angle at the centre for fat?
Angle at the centre = 5% of
The angle for fat is .
- What is the angle at the centre for fibre?
Angle at the centre = 30% of
The angle for fibre is .
- What is the angle at the centre for protein?
Angle at the centre = 10% of
The angle for protein is .
- What is the angle at the centre for "other" (which means nutrients that were not counted separately)?
Angle at the centre = 10% of
The angle for other is .
- Check your results.
Check that your calculations are correct by adding all the angles together. You should end up with .
Angles at the centre =
The calculations are correct, because the total is .
-
A survey was done of the vehicles (cars, buses, and so on) that passed the school from 07:00 to 09:00 one morning.
The results were recorded in the following frequency table.
Type of vehicle Percentage Motor cars 35% Bicycles 5% Motor bikes 15% Buses 20% Trucks 25% The researchers who did the survey want to draw a pie chart to illustrate the data.
- Calculate the angle at the centre for motor cars.
Find the angle at the centre for motor cars by first reading off the table the percentage of vehicles that were motor cars, and then calculating the angle at the centre.
35% of the vehicles were motor cars.
Angle at the centre = 35% of
The angle for motor cars is .
- Calculate the angle at the centre for bicycles.
Identify the percentage, and convert to degrees.
Angle at the centre = 5% of
The angle for bicycles is .
- Calculate the angle at the centre for motor bikes.
Angle at the centre = 15% of
The angle for motor bikes is .
- Calculate the angle at the centre for buses.
Angle at the centre = 20% of
The angle for buses is ,
- Calculate the angle at the centre for trucks.
Angle at the centre = 25% of
The angle for trucks is .
- Add the angles together to make sure that the calculations are correct.
Check that your calculations are correct by adding all the angles together. You should end up with .
Angles at the centre =
The calculations are correct, because the total is .
12.2 Practical applications
Pie charts are useful for comparing two sets of data.
- We can compare the percentage marked for a specific category on two pie charts, and say which percentage is greater.
- We can calculate actual numbers using the percentages given on two pie charts, and say which number is greater.
Because pie charts are created using percentages, we can compare pie charts even if the total number for each data set used in each pie chart is not the same.
Worked example 12.4: Comparing two pie charts
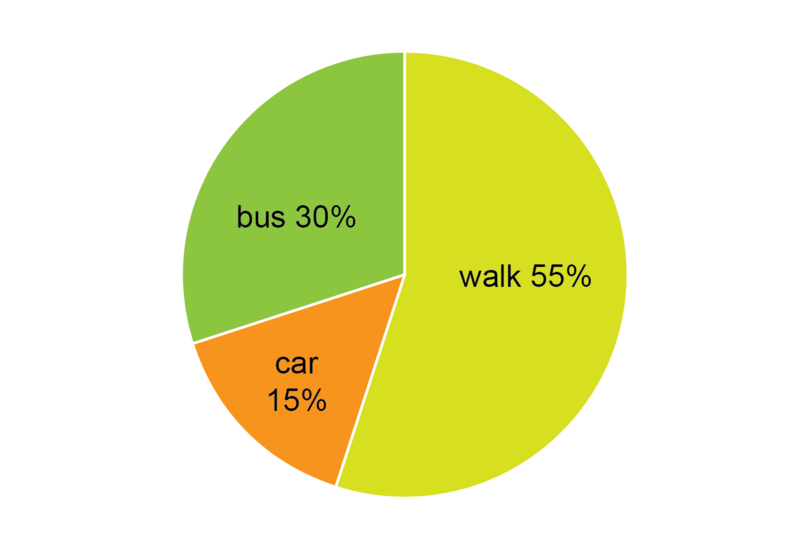
A survey was carried out to find out how the JSS2 students and the JSS3 students came to school on a particular day.
A pie chart was created to show the methods the JSS2 students used to travel to school on that day.
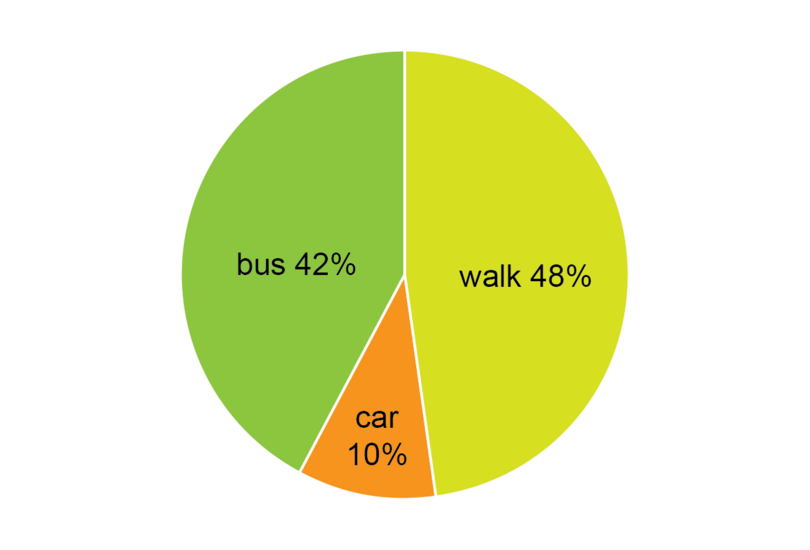
Another pie chart was created to show the methods the JSS3 students used to travel to school on that day.
- Did a greater percentage of JSS2 students or of JSS3 students walk to school on that day?
- 100 JSS2 students were surveyed on that day. Calculate how many JSS2 students walked to school that day.
- 150 JSS3 students were surveyed on that day. Calculate how many JSS3 students walked to school that day.
- Did a greater number of JSS2 students or JSS3 students walk to school on that day?
-
Step 1: Compare the percentage of JSS2 and JSS3 students who walked to school.
55% of the JSS2 students walked to school.
48% of the JSS3 students walked to school.
A greater percentage of JSS2 students walked to school.
-
Step 2: Calculate how many of the 100 JSS2 students walked to school on that day.
Number of JSS2 students who walked to school = 55% of 100 students = 55 students
-
Step 3: Calculate how many of the 150 JSS3 students walked to school on that day.
Number of JSS3 students who walked to school = 48% of 150 students = 72 students
-
Step 4: Did more JSS2 or JSS3 students walk to school on that day?
JSS2 students who walked on that day = 55
JSS3 students who walked on that day = 72
More JSS3 students walked on that day than JSS2 students.
Exercise 12.4: Compare two pie charts
You may use a calculator to carry out the calculations for this exercise.
-
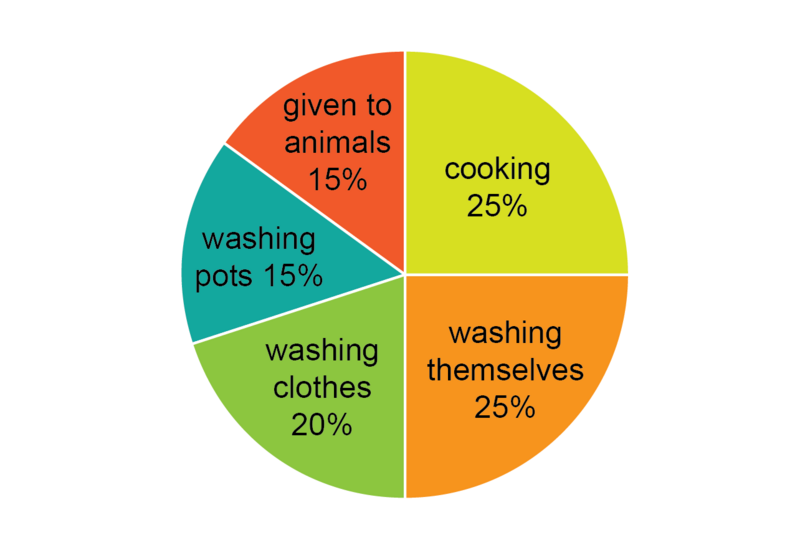
Research was done to find out about the way water is used in two Nigerian villages. Pie charts were created to show the results of the research.
Village A
Village B
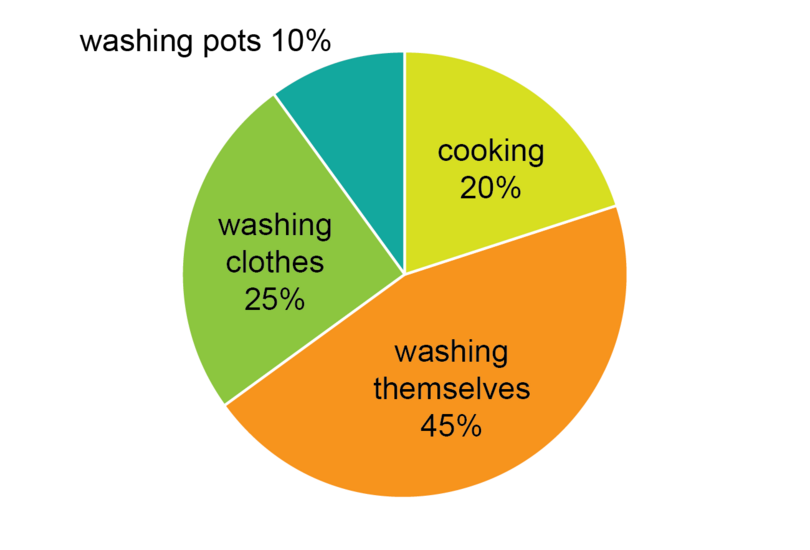
In Village A, approximately 324 litres of water are used each day.
In Village B, approximately 300 litres of water are used each day.
- Compare the amount of water in litres the two villages used for cooking.
Amount of water used by Village A for cooking = 25% of 324 litres = 81 litres
Amount of water used by Village B for cooking = 20% of 300 litres = 60 litres
Village A used 81 litres, and Village B used 60 litres for cooking, so Village A uses far more water for cooking.
- What fraction, in simplest form, of the water used in Village A is given to animals?
Fraction of water given to animals = 15% = =
of the water used in Village A is given to animals.
- Calculate the number of litres of water the people of Village A used for washing themselves.
Amount of water the people of Village A used for washing themselves = 25% of 324 litres = 81 litres
- Calculate the number of litres of water the people of Village B used for washing themselves.
Amount of water the people of Village B used for washing themselves = 45% of 300 litres = 135 litres.
- Did the people of Village A or of Village B use more water for washing themselves?
The people of Village B used more water for washing themselves than the people of Village A.
-
The examination marks of the 80 students in JSS3 at School X and the 60 students in JSS3 at School Y were organised, and a pie chart was drawn showing the marks for each school.
School X
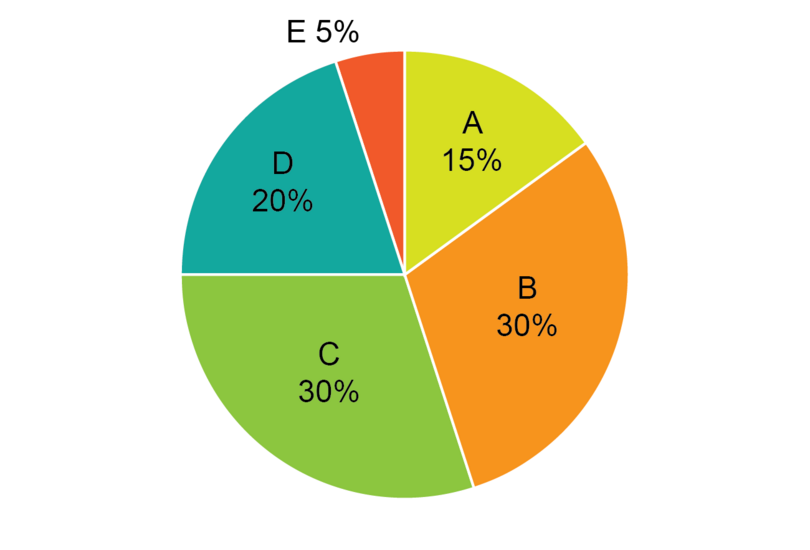
School Y
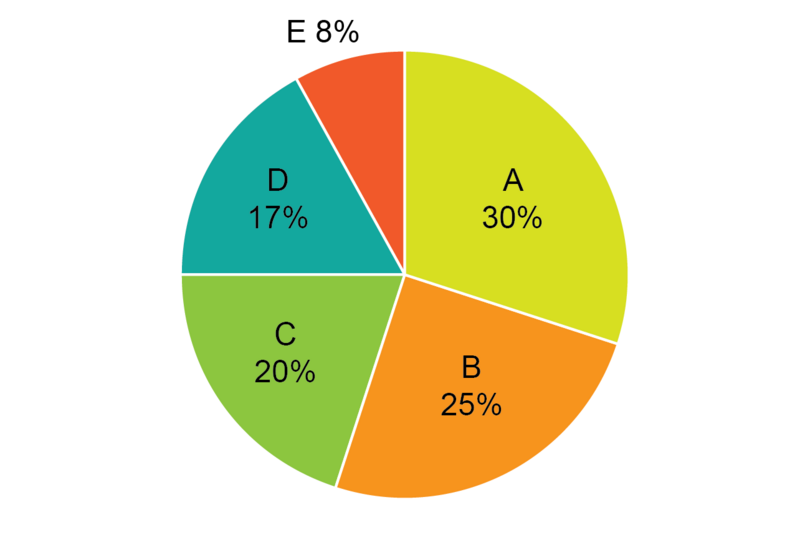
- Give the mode of the School X marks and the mode of the School Y marks.
On the School X pie chart we can see the highest percentage was 30%.
30% of the School X students got a B, and 30% got a C.
So the modes of the School X marks are B and C.
On the School Y pie chart we can see that that the highest percentage was 30%.
30% of the School Y got an A.
So the mode of the School Y marks is an A.
Modes: School X, B and C; School Y, A
- What percentage of the School X students got an A or a B in the examinations?
Percentage of School X students who got an A or a B = 15% + 30% = 45%
- How many School X students got an A or a B in the examinations?
There were 80 School X students.
Number of School X students that got an A or B = 45% of 80 students = 36 students
- What percentage of the School Y students got an A or B in the examination?
Percentage of School Y students that got an A or a B = 30% + 25% = 55%
- How many School Y students got an A or B in the examinations?
There were 75 School Y students.
Number of students = 55% of 60 students = 33 students
- Did more School X or School Y students get an A or B in the examination?
Number of School X students that got an A or B = 36
Number of School Y students that got an A or B = 33
More School X students than School Y students got an A or B.
12.3 Summary
- We can represent data we have collected using a pie chart.
- We can compare sectors of a pie chart.
- We can use the fact that the percentages in the sectors of a pie chart must add up to 100% to find the missing percentages.
- We can find the angles at the centre of a pie chart by multiplying by the percentage given for a sector.
- We can find out information about two groups of data by comparing two pie charts. Because pie charts are created using percentages, the total number for each data set used in each pie chart does not need to be the same.